I have seen Word-cloud in so many places such as magazines, websites, blogs, etc. however never thought of making it by myself. I would like to thank R that taught me such a wonderful technique which everybody would like to learn. I don’t know if there are any other free options are available to create word-cloud. Let me give a quick explanation about R first, R is a free source packages and very useful for statistical analysis. We can use R for various purposes, from data mining to data visualization. Word-cloud is a tool where you can highlight the words which have been used the most in quick visualization. If you know the correct procedure and usage, then Word Cloud is simple in R Studio. Further, a package called “Word-cloud” is released in R, which will help us to create word-cloud. You can follow my simple four steps mentioned below to create word-cloud. Those are new to R or Word Cloud, I would suggest first install R studio from the link rstudio.com Also, the following...
Do you want to know, which are the top cities in the world are most and least livable? If yes…please find the below Visualization. I have used annual rankings from the Economist Intelligence Unit (EIU) to show the world’s most livable cities, measuring different categories including: stability, healthcare, culture and environment, education, and infrastructure. Source: https://lnkd.in/gh5q4yEK Key Insights: • Vienna (Austria) tops the rankings in 2022, as it did in 2019 and 2018. • Russia’s invasion of Ukraine on February 24th has forced to exclude Kiev (Ukraine) from survey. • Eastern European cities slip in the rankings amid increased geopolitical risks. • Western European and Canadian cities dominate the top of our rankings. Life is almost back to normal in these cities on account of high covid-19 vaccination rates and the easing of restrictions. • Damascus (Syria) and Tripoli (Libya) continue to languish at the bottom of the list—along with Lagos (Nigeria)—as they face ...
Mental illness is common among entrepreneurs. One in four entrepreneurs will experience a mental health disorder in their lifetime. Depression and Anxiety are the most common mental health disorders among entrepreneurs. Depression is distinguished by feelings of sadness, hopelessness and fatigue.
Well, more than 7,100 languages are spoken in the world today. Each and every one of them make the world a diverse and beautiful place. So can you guess which are the top languages are spoken by people in the world? The numbers below are gathered from the 2023 edition of Ethnologue , which is considered one of the most reliable language databases available. While you should treat the number of speakers as a rough estimate, you can be confident that the ranking of each language is accurate. The ranking of the most popular languages also changes slightly when comparing native speakers to total usage. We’ve provided both lists to help paint a clearer picture of the world’s languages. Happy Reading :-) Well, more than 7,100 languages are spoken in the world today. Each and every one of them make the world a diverse and beautiful place. So can you guess which are the top languages are spoken by people in the world? The numbers below are gathered from the 2023 edition of Ethnologue , w...
Goal of the Project The goal of the project is to create an infographic-style visual to educate new viewers, highlight the magnitude of the event, and build anticipation for this year's Tour de France. This challenge requirement is different from others as here we are not getting any business insights or solution to do better. Here we have the information and we tried to spread information in easy and simple manner that more viewers can show interest in the coming years. As there are still many people has lack of knowledge about this event and access to watch this event (or lack of resources). What were business need The need is to create an infographic visual to educate new viewers about the world’s largest event Tour de France and 3.5 billion viewers were interested to watch from all around the world. My focus is to attract more viewers and provide base information or history that they don’t know. We are 8 billion population and we have to showcase this largest annual sporting ...
Shows both the Free Cash Flow to Firm (FCFF) and Equity components of the valuation of an enterprise. Free Cash Flow to the Firm v/s Free Cash Flow to Equity Inputs Earnings before interest and taxes (EBIT) = 100 E xpected growth for next 5 years = 20% Expected growth after year 5 = 5% Tax rate = 40% Debt ratio for the firm = 20% Cost of equity = 15% Pre-tax cost of debt = 9% Return on capital in high growth= 15% Return on capital in stable growth = 10% 0 1 2 3 4 5 Terminal Year Expected Growth rate 10% 10% 10% 10% 10% 5% Reinvestment rate 66.67% 66.67% 66.67% 66.67% 66.67% 50.00% EBIT(Earnings before interest & tax) ...
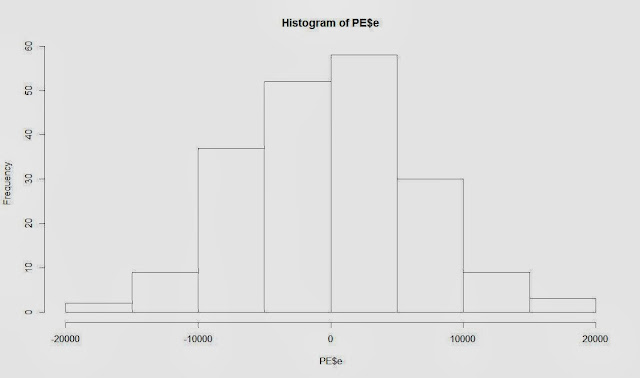
Assignment:4 Assignment 4 deadline got over today. So i am putting the assignment 4 questions and answers here. Hope it will help others to solve the questions. setwd(" ") library(psych) PE=read.table("Stats1.13.HW.04.txt",header = T) describe(PE) #Question1: What is the correlation between salary and years of professional experience? cor(PE[2:4]) round(cor(PE[2:4]),2) salary years courses salary 1.0000000 0.7448961 0.5410249 years 0.7448961 1.0000000 0.3336635 courses 0.5410249 0.3336635 1.0000000 > round(cor(PE[2:4]),2) salary years courses salary 1.00 0.74 0.54 years 0.74 1.00 0.33 courses 0.54 0.33 1.00 #Question2: What is the correlation between salary and courses completed? round(cor(PE$salary, PE$courses),2) [1] 0.54 ...
Italy, France, and Spain were the top three producers of wine worldwide as of 2022. That year, France produced about 45.6 million hectoliters of wine. Italy was the leading producer of wine in 2022, and had the highest export volume of wine in that year, at 21.9 million hectoliters. The other two top wine producers were also the top exporters. Spain exported 21.2 million hectoliters and France, 14 million. The world vineyard surface area is estimated to be 7.3 mha in 2022, only marginally lower compared to 2021 (-0.4%). The surface area of the world vineyard seems to have stabilised since 2017. The current stabilisation, however, hides heterogeneous evolutions in the main vine growing countries. The world vineyard surface area is estimated to be 7.3 mha in 2022, only marginally lower compared to 2021 (-0.4%). The surface area of the world vineyard seems to have stabilised since 2017. The current stabilisation, however, hides heterogeneous evolutions in the main vine growing countries. ...
The Goal of the project: The goal of the project is to provide detailed analysis of new car registration market in Romania. In a single page format, you can the all the necessary details which required to know about the automobile industry. Also need to look how electric segment is doing in the market. What was business needs: The business need of the project to find the growing segment, the top car maker or model their YoY growth, the market share of different car segment etc What are your Insights: My top insights from this project are: 1.The market value is increasing significantly in 2023, which is coming to pre covid level. 2.Gasoline is top segment in car market with more than 65% market share but electric car segment is growing faster than this segment and diesel segment. 3.Dacia is top car maker in Romania and all top five selling cars are from Dacia. Dacia Logan is top selling card model but the top sales growth of the car model is Dacia Jogger. 4.Dacia is the top car se...


.jpg)


Comments
Post a Comment