Top 10 Polluted Countries in the World - 2022
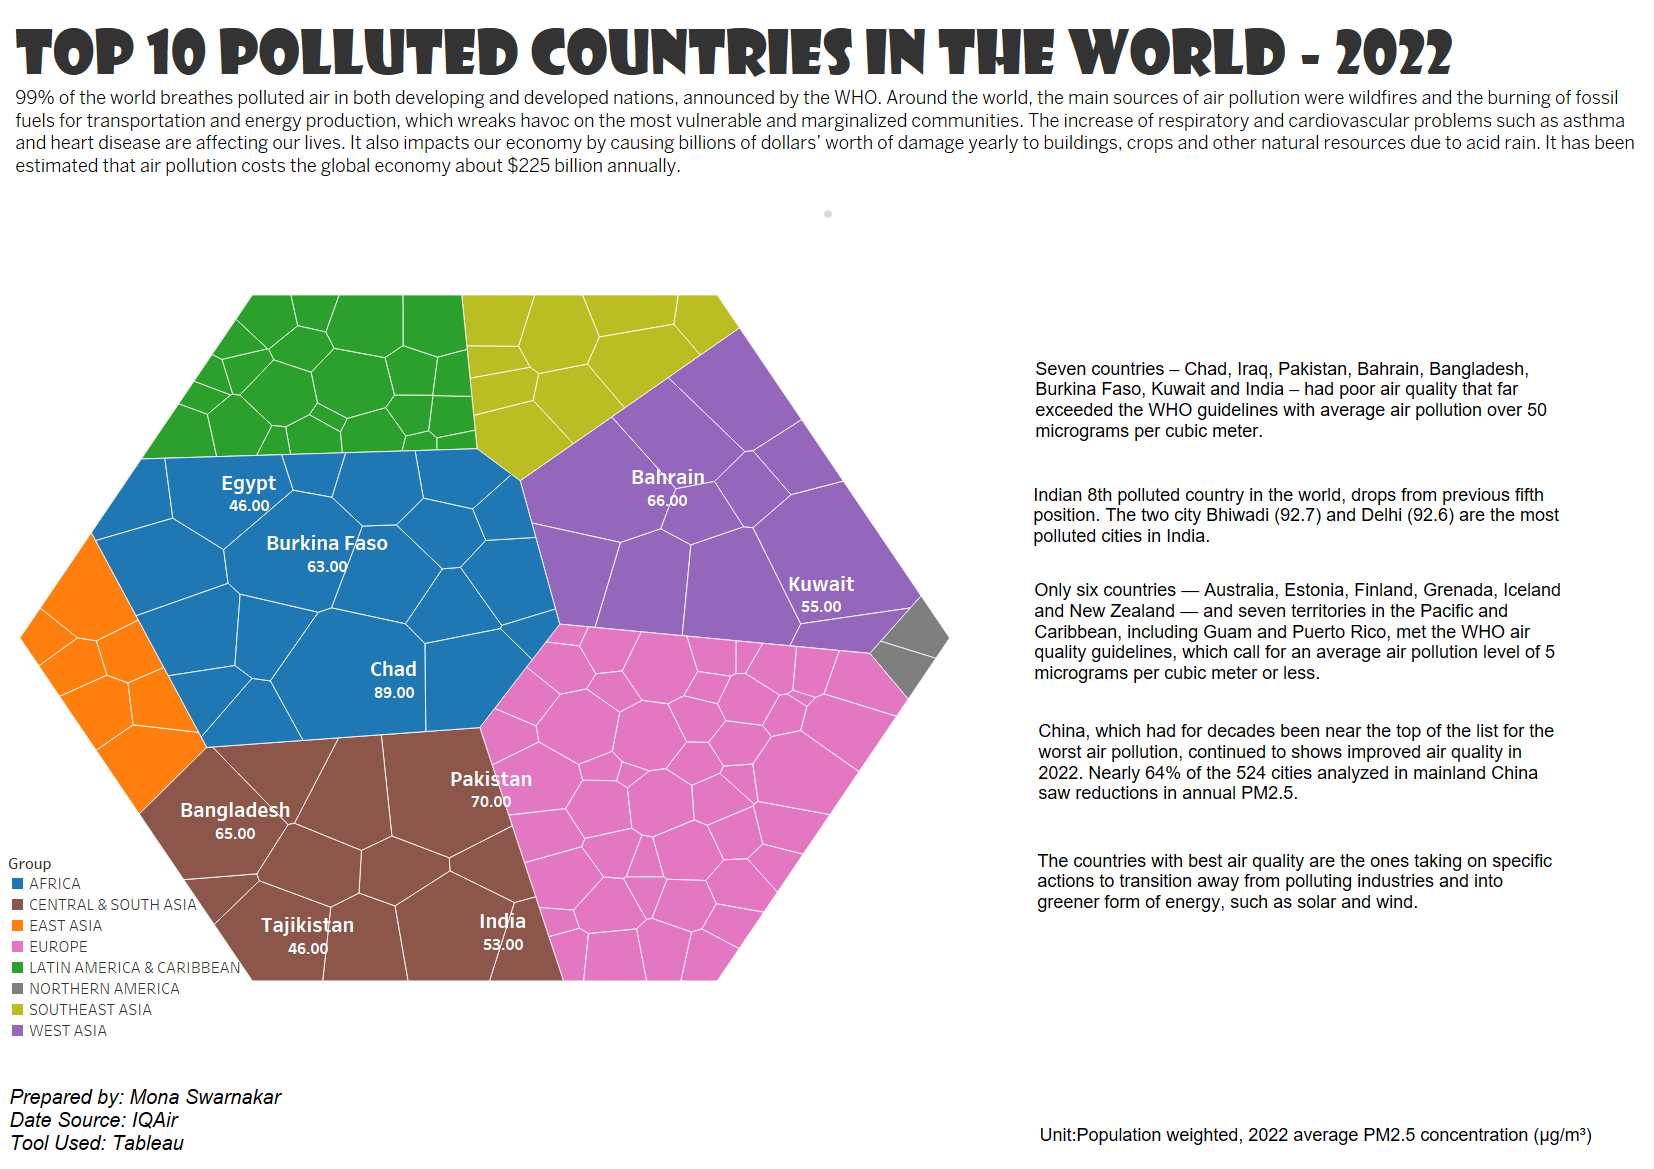
“Too many people around the world don’t know that they are breathing polluted air,” Aidan Farrow, senior air quality scientist at Greenpeace International, said in a statement. About 90% of the global population in 2022 experienced unhealthy air quality, and only six countries met the World Health Organization’s recommendations of safe air pollutant levels, according to a new report from Swiss air quality technology company IQAir. IQAir measured air quality levels based on the concentration of lung-damaging airborne particles known as PM 2.5. Research shows that exposure to such particulate matter can lead to heart attacks, asthma attacks and premature death. Studies have also linked long-term exposure to PM 2.5 with higher rates of death from Covid-19. The top five most polluted countries in 2022 were Chad, Iraq, Pakistan, Bahrain and Bangladesh. The most polluted cities globally were Lahore, Pakistan; Hotan, China; Bhiwadi, India; Delhi, India; and Pesh...