Posts

Showing posts with the label Power BI

TOP WINE PRODUCTION AND CONSUMPTION COUNTRIES - 2022

Image
Italy, France, and Spain were the top three producers of wine worldwide as of 2022. That year, France produced about 45.6 million hectoliters of wine. Italy was the leading producer of wine in 2022, and had the highest export volume of wine in that year, at 21.9 million hectoliters. The other two top wine producers were also the top exporters. Spain exported 21.2 million hectoliters and France, 14 million. The world vineyard surface area is estimated to be 7.3 mha in 2022, only marginally lower compared to 2021 (-0.4%). The surface area of the world vineyard seems to have stabilised since 2017. The current stabilisation, however, hides heterogeneous evolutions in the main vine growing countries. The world vineyard surface area is estimated to be 7.3 mha in 2022, only marginally lower compared to 2021 (-0.4%). The surface area of the world vineyard seems to have stabilised since 2017. The current stabilisation, however, hides heterogeneous evolutions in the main vine growing countries. ...

IT HELP DESK ANALYSIS

Image
When its about IT, how we can leave behind the IT help desk which is the major part of this industry. I found this data set interesting to analyze. There is two file one is Agent details and IT tickets data. The initial job had to do was the changes of the data as mentioned below: In the Tickets Table • The client requires the canvas settings of the PBI report to be H:1080 - W: 1920 • The client would like columns Severity and Priority to be split into 2 columns, creating an ID and classification columns. Example Severity Key column = 0 and Severity Type = Unclassified. • The Average Resolution time is 4.5 days. The Client would like to create a new column where if the Resolution time is above 3.5 days = "Outside SLA" and if it is below "Within SLA". This will allow the client to push for all calls to stay within the limit by targeting these calls and agents. In the IT Agents Table • Column Full Name to be split into 2 columns Name and Last Name, where last ...

INDIA HAS BEEN WRONGLY PLACED AT 126TH RANK IN THE WORD HAPPINESS REPORT 2023

Image
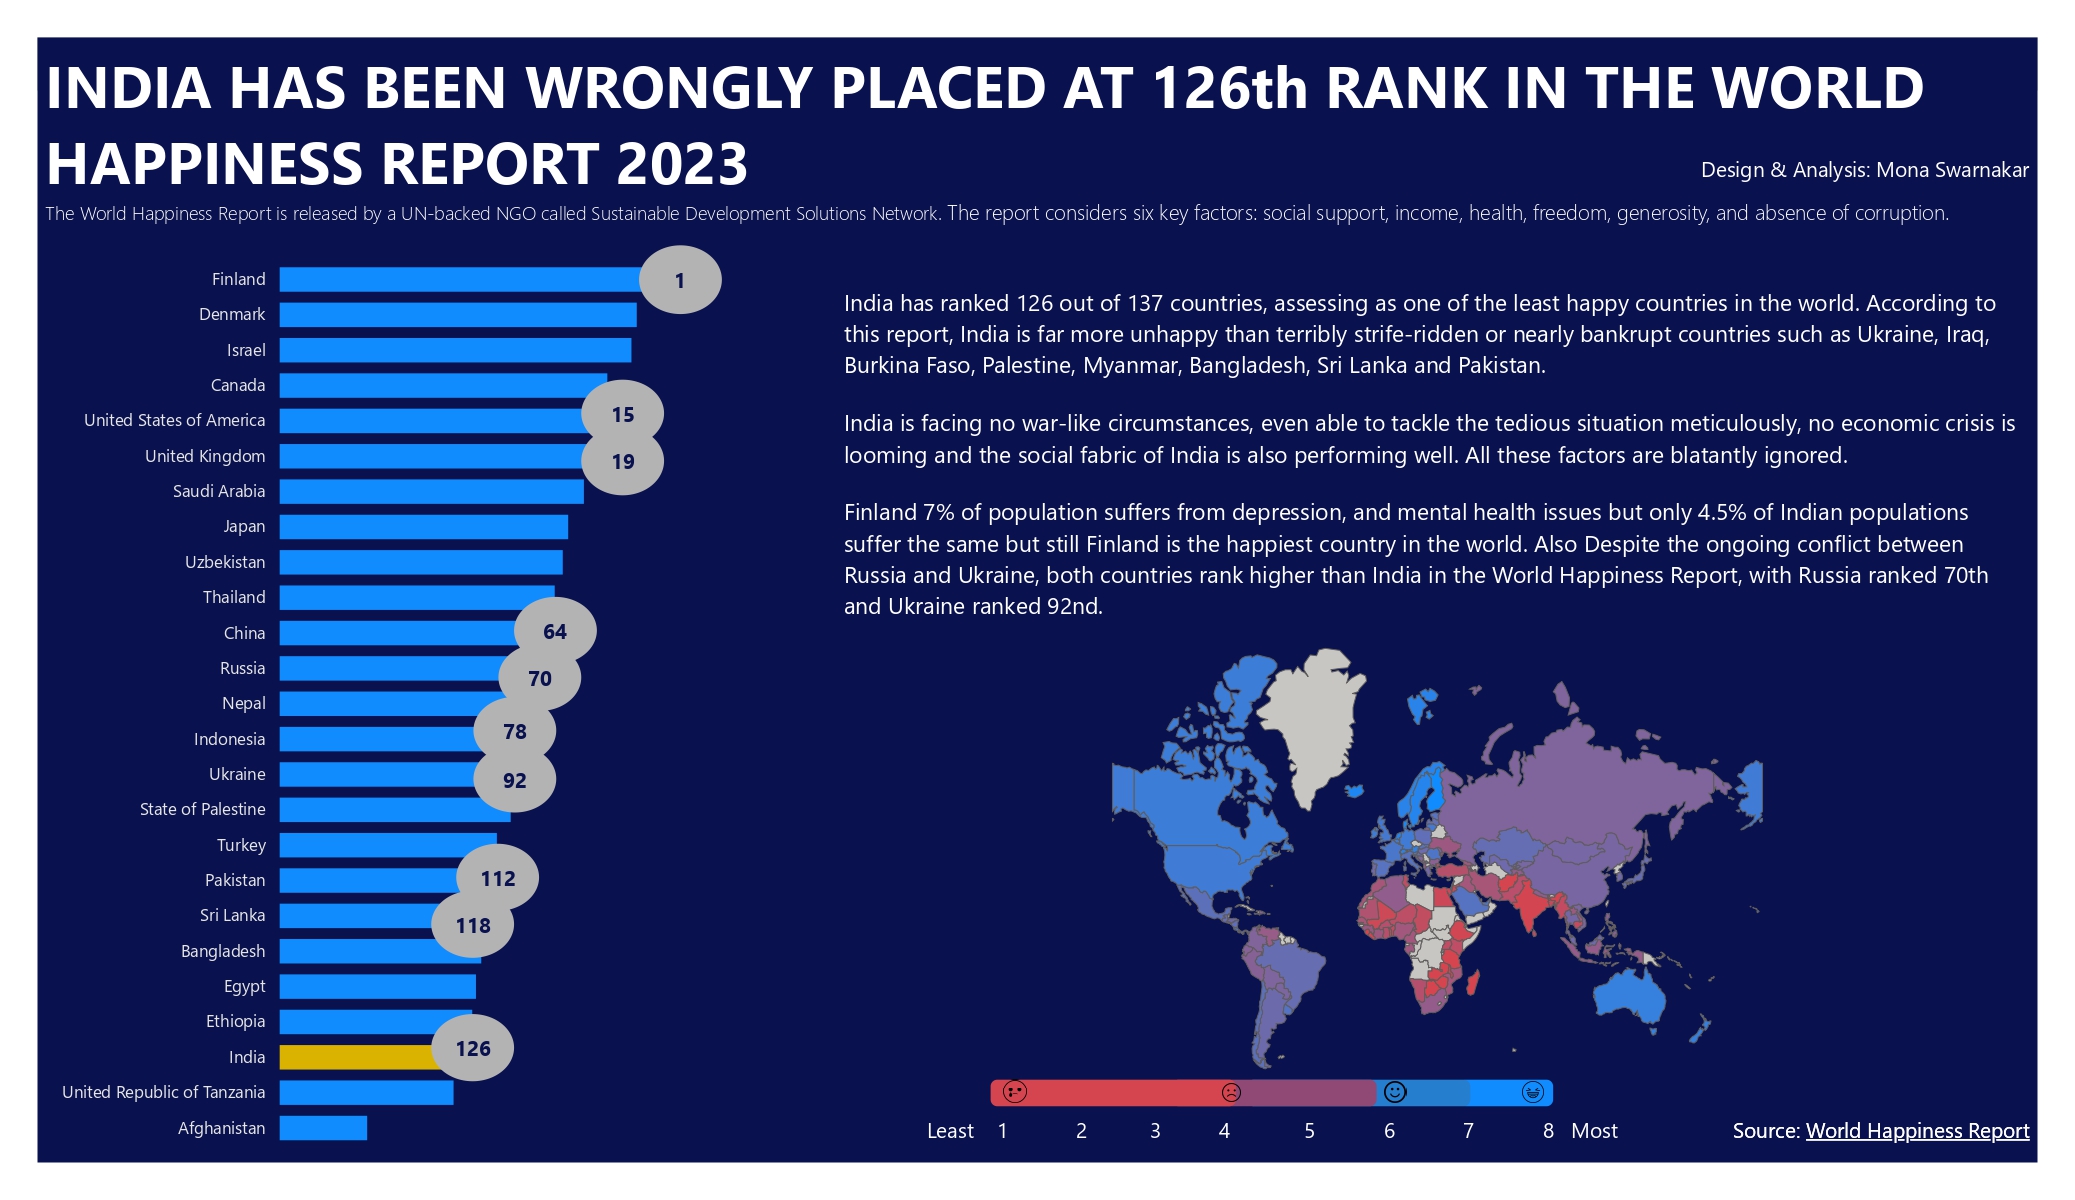
  T h e World Happiness Report is an annual report published by the United Nations Sustainable Development Solutions Network. It ranks countries based on how happy their citizens perceive themselves to be and provides analysis of the factors that contribute to happiness, such as income, social support, and life expectancy. The 2023 World Happiness Report has been released, and it shows that Finland remains the happiest country in the world for the sixth year in a row. Denmark, Iceland, Israel, and the Netherlands are the next happiest countries, with other European countries such as Sweden, Norway, Switzerland, and Luxembourg also making the top 10. Now question raise here that how India’s position in the World Happiness Report has ranked at 136th place, despite having the world’s fastest-growing economy, India’s ranking in the report has consistently been low, leading some to question how it can be ranked lower than countries in turmoil.Despite the ongoing conflict between Russia ...

Provide insights to Telangana Government Tourism Department

Image
PROBLEM STATEMENT: Telangana is one of the top tourism destination with great places to visit such as forts, temples, rivers, wildlife, etc. The problem here is to identify, how to improve the growth of the tourism sector in Telangana, for both domestic and foreign visitors. TOOLS USED: Only Power BI. FINDINGS I don’t have to introduce about this state – Telangana. We all have read about their culture, historic places, food, streets and everything. However, we are still somewhat lacking in promoting this place and tourists are missing a life time opportunity of visiting this great place. Post the data analysis and research, I found that there are many districts where people are not aware of the cultural and historic places. Also, we need to increase foreign visitors as currently there are only few districts with foreign tourist footprints. As Hyderabad is the capital city of the Telangana, visitors are more there, but we need to focus on all other district as well. SOLUTIONS The Telang...

Mobile Phone Sales Analysis

Image
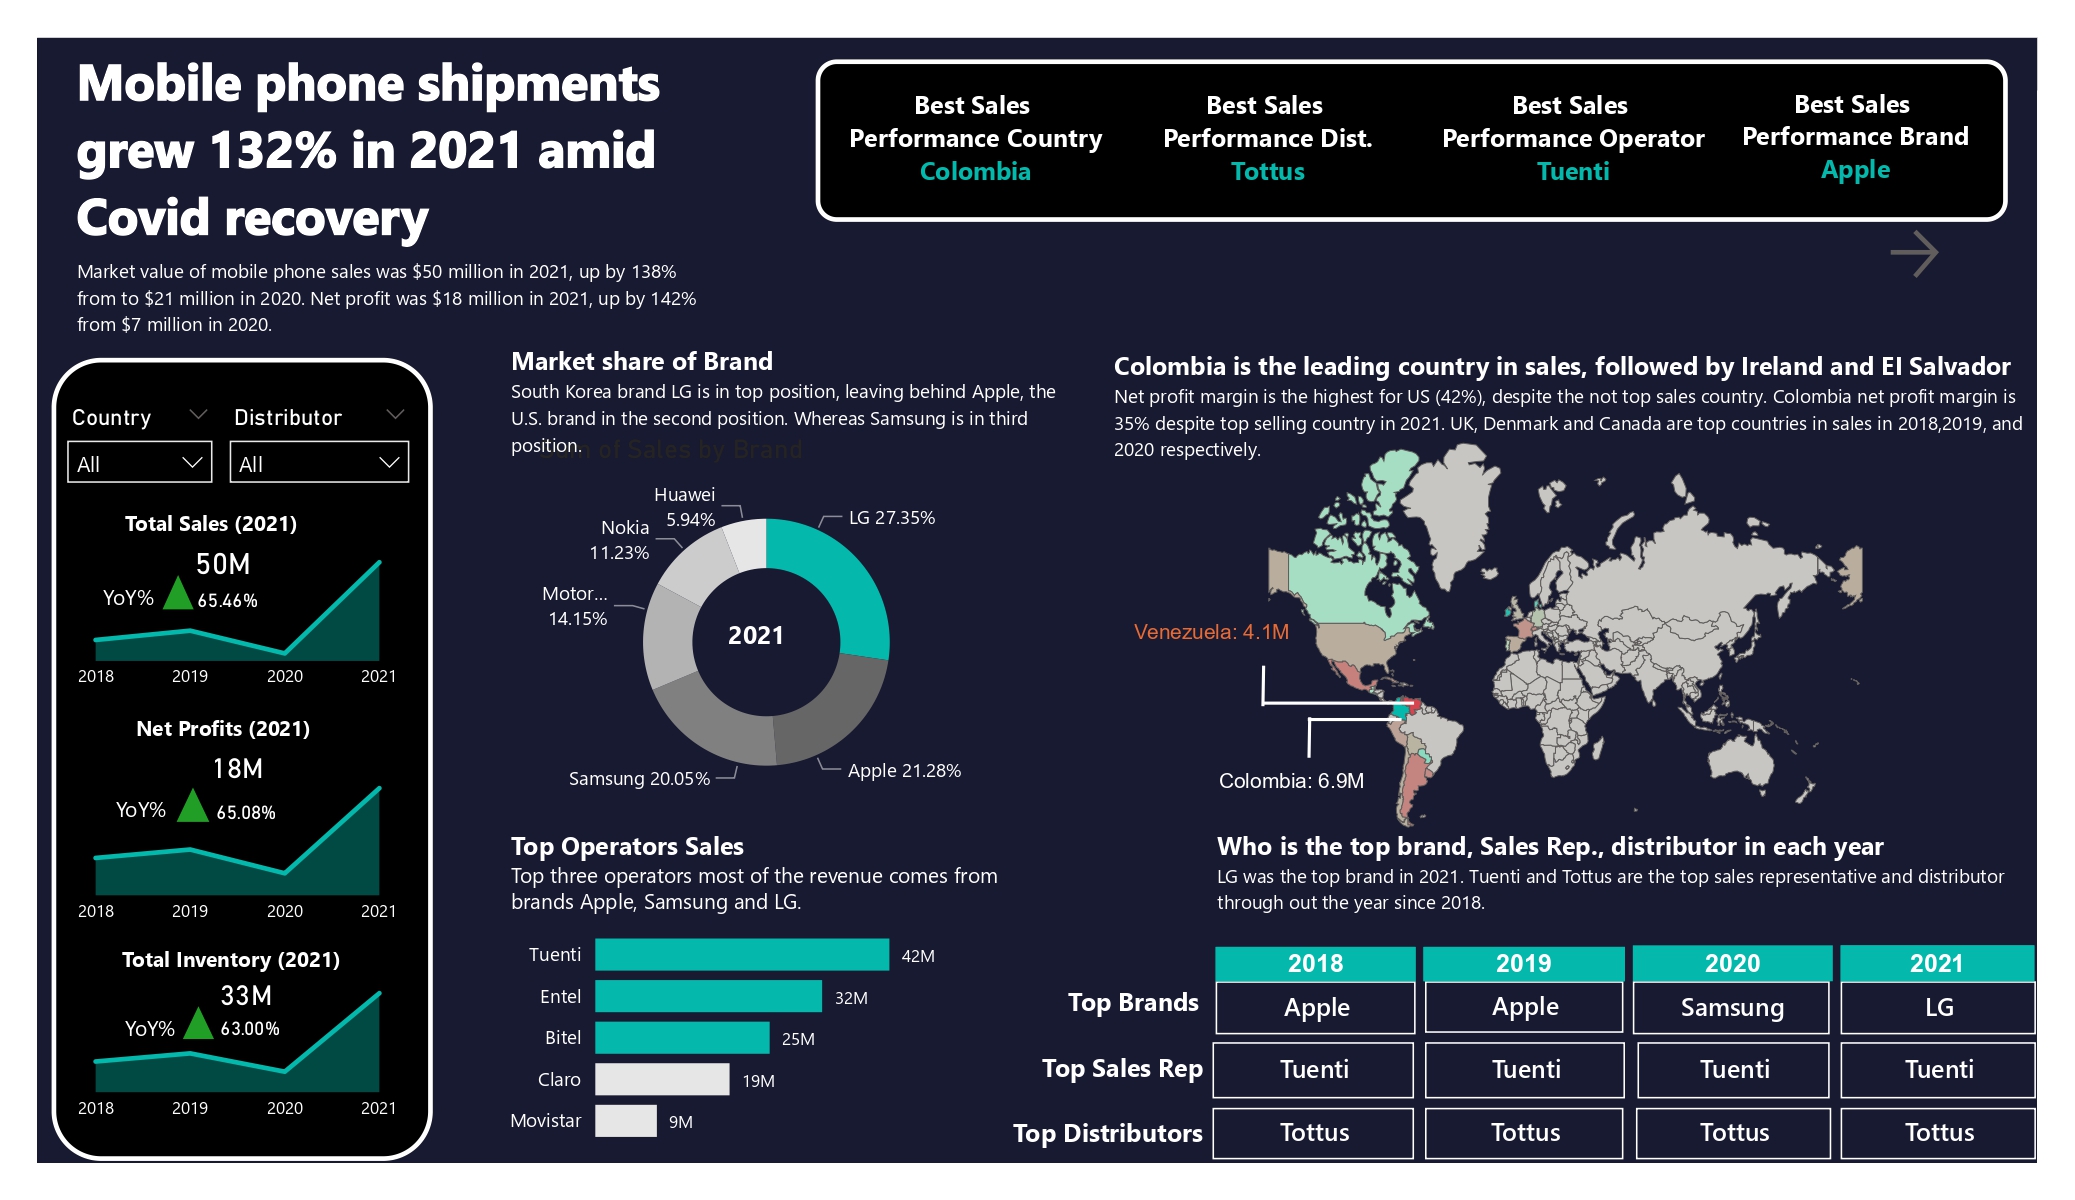
  Project Goal: This role is for a Sales analyst to develop our client's Mobile phone sales analysis report. The client has provided us with relevant mobile phone sales data stored in an Excel file. This is an Exploratory Data Analysis (EDA), so your goal is to explore the business patterns in the data and summarize your discoveries into meaningful sales insights. Project Questions: From 2018-2021, which country and distributor had the best sales performance? What was the seasonal sales trend in each country and distributor? What was the seasonal inventory cost trend in each country and distributor? What was the seasonal net profit trend in each country and distributor? Each year, which brand is the best seller in each country and distributor? Who is each country's most successful sales rep and distributor? Which country had the lowest/highest inventory cost from 2018-2021? Which country had the lowest/highest net profit from 2018-2021? Can we predict the 2023 sales trend based...

HR DATA ANALYSIS

Image
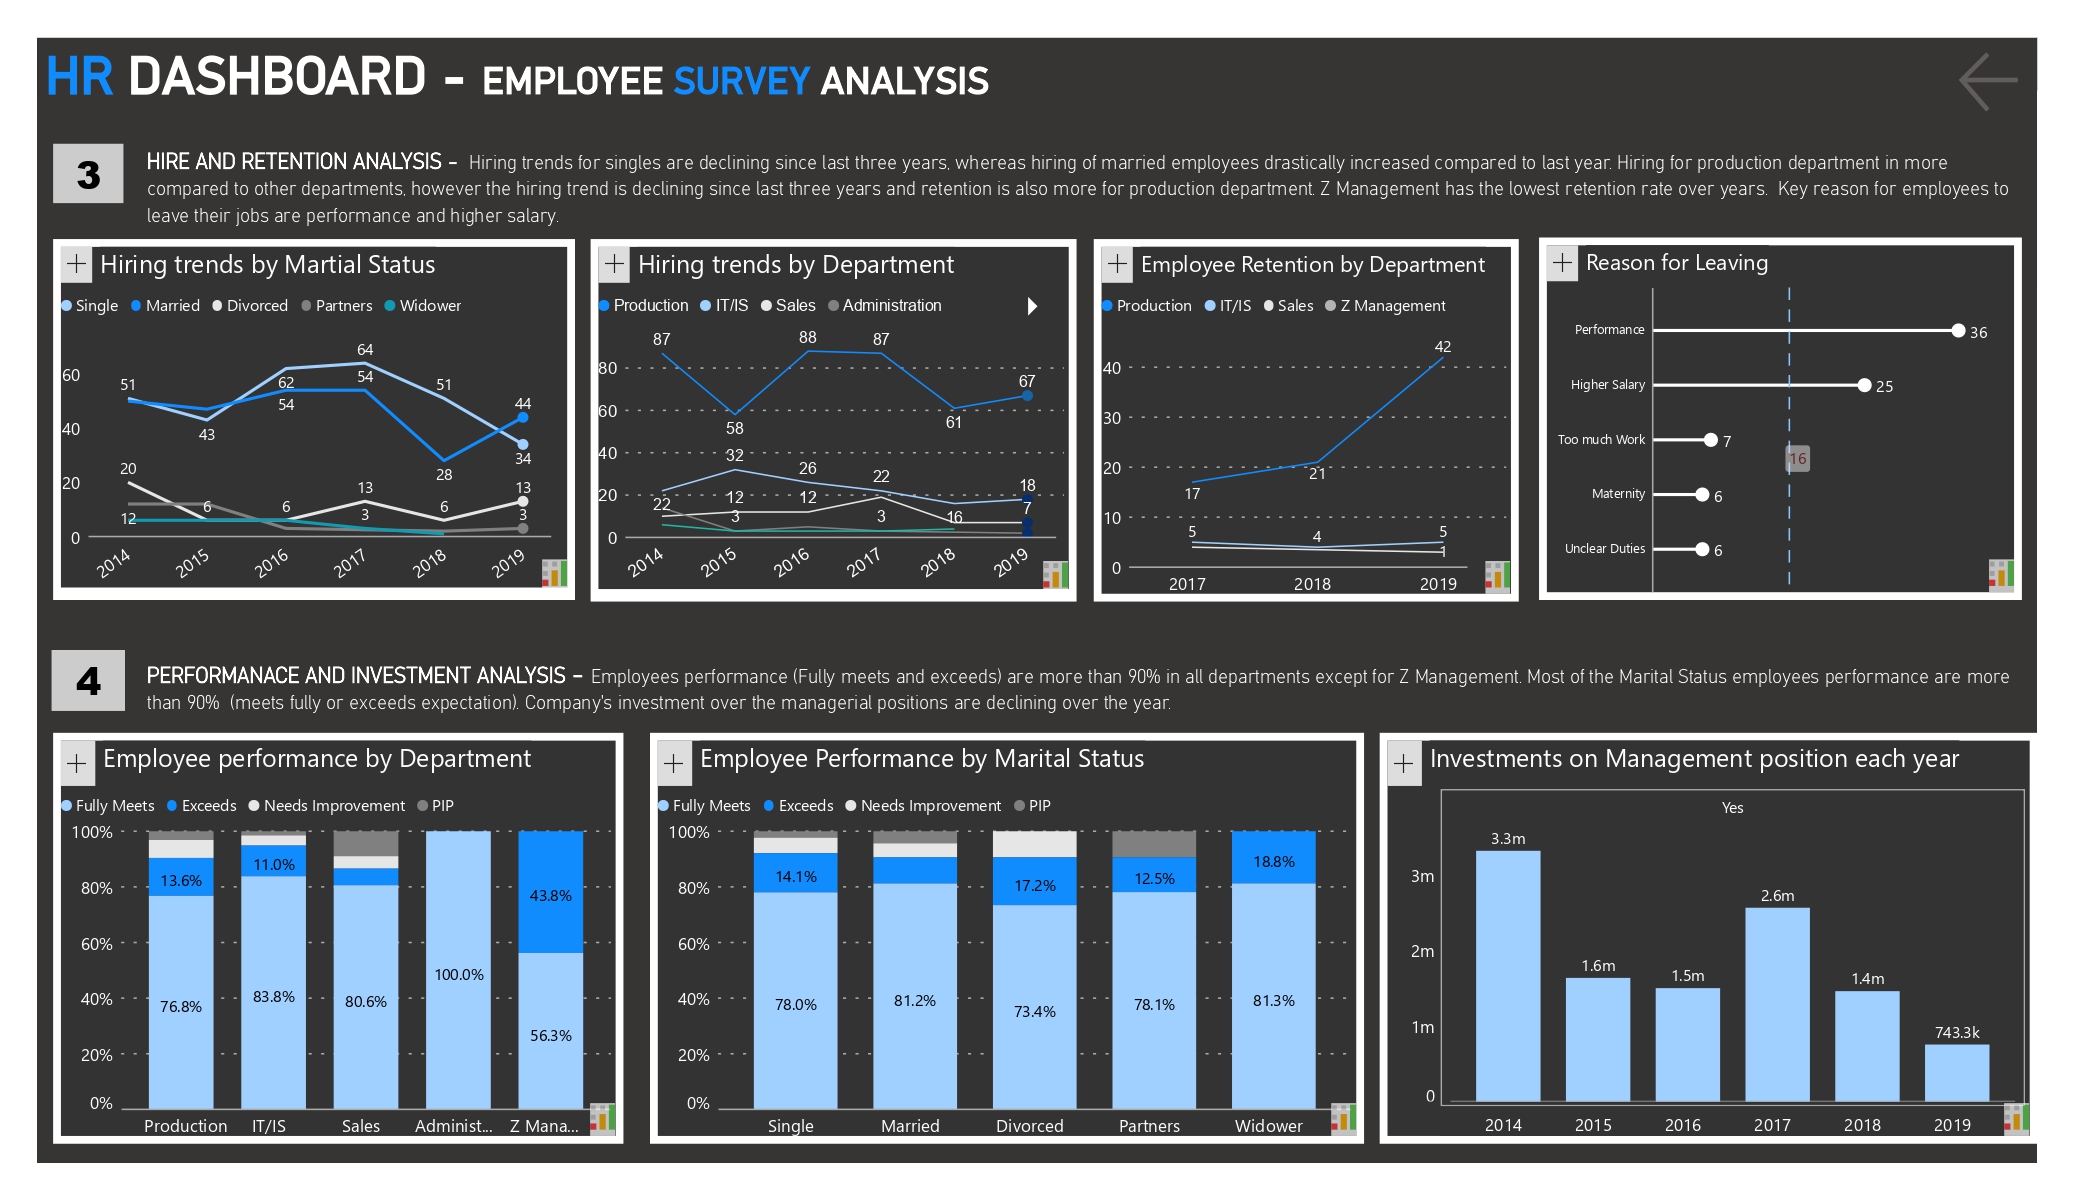
  Project Questions: This role is a HR data analyst to develop a HR Dashboard for your organization. The organization has purchased Inforiver as its primary custom visuals to standardize and simplify the reporting. It is an opportunity for you to show your creativity about our investment. Required to answer a few, not all, the questions below, they are prepared to help you to focus on an aspect of your analysis. Can you find the age segments about the employees? What is the gender ratio each hire year? What is the martial status distributed each hire year? Did number of single new hires increase or decrease historically? What branch had the most/fewest new hires each year? How about the employee retention rate each year? What is the main leave reason? 6. Which department had the most/fewest new hires each year? Which department had the highest/lowest retention rate each year? Which department had the highest/lowest average satisfaction score each year? Can you provide the yearly av...