Posts

Showing posts from July, 2023

INDIA HAS BEEN WRONGLY PLACED AT 126TH RANK IN THE WORD HAPPINESS REPORT 2023
Image
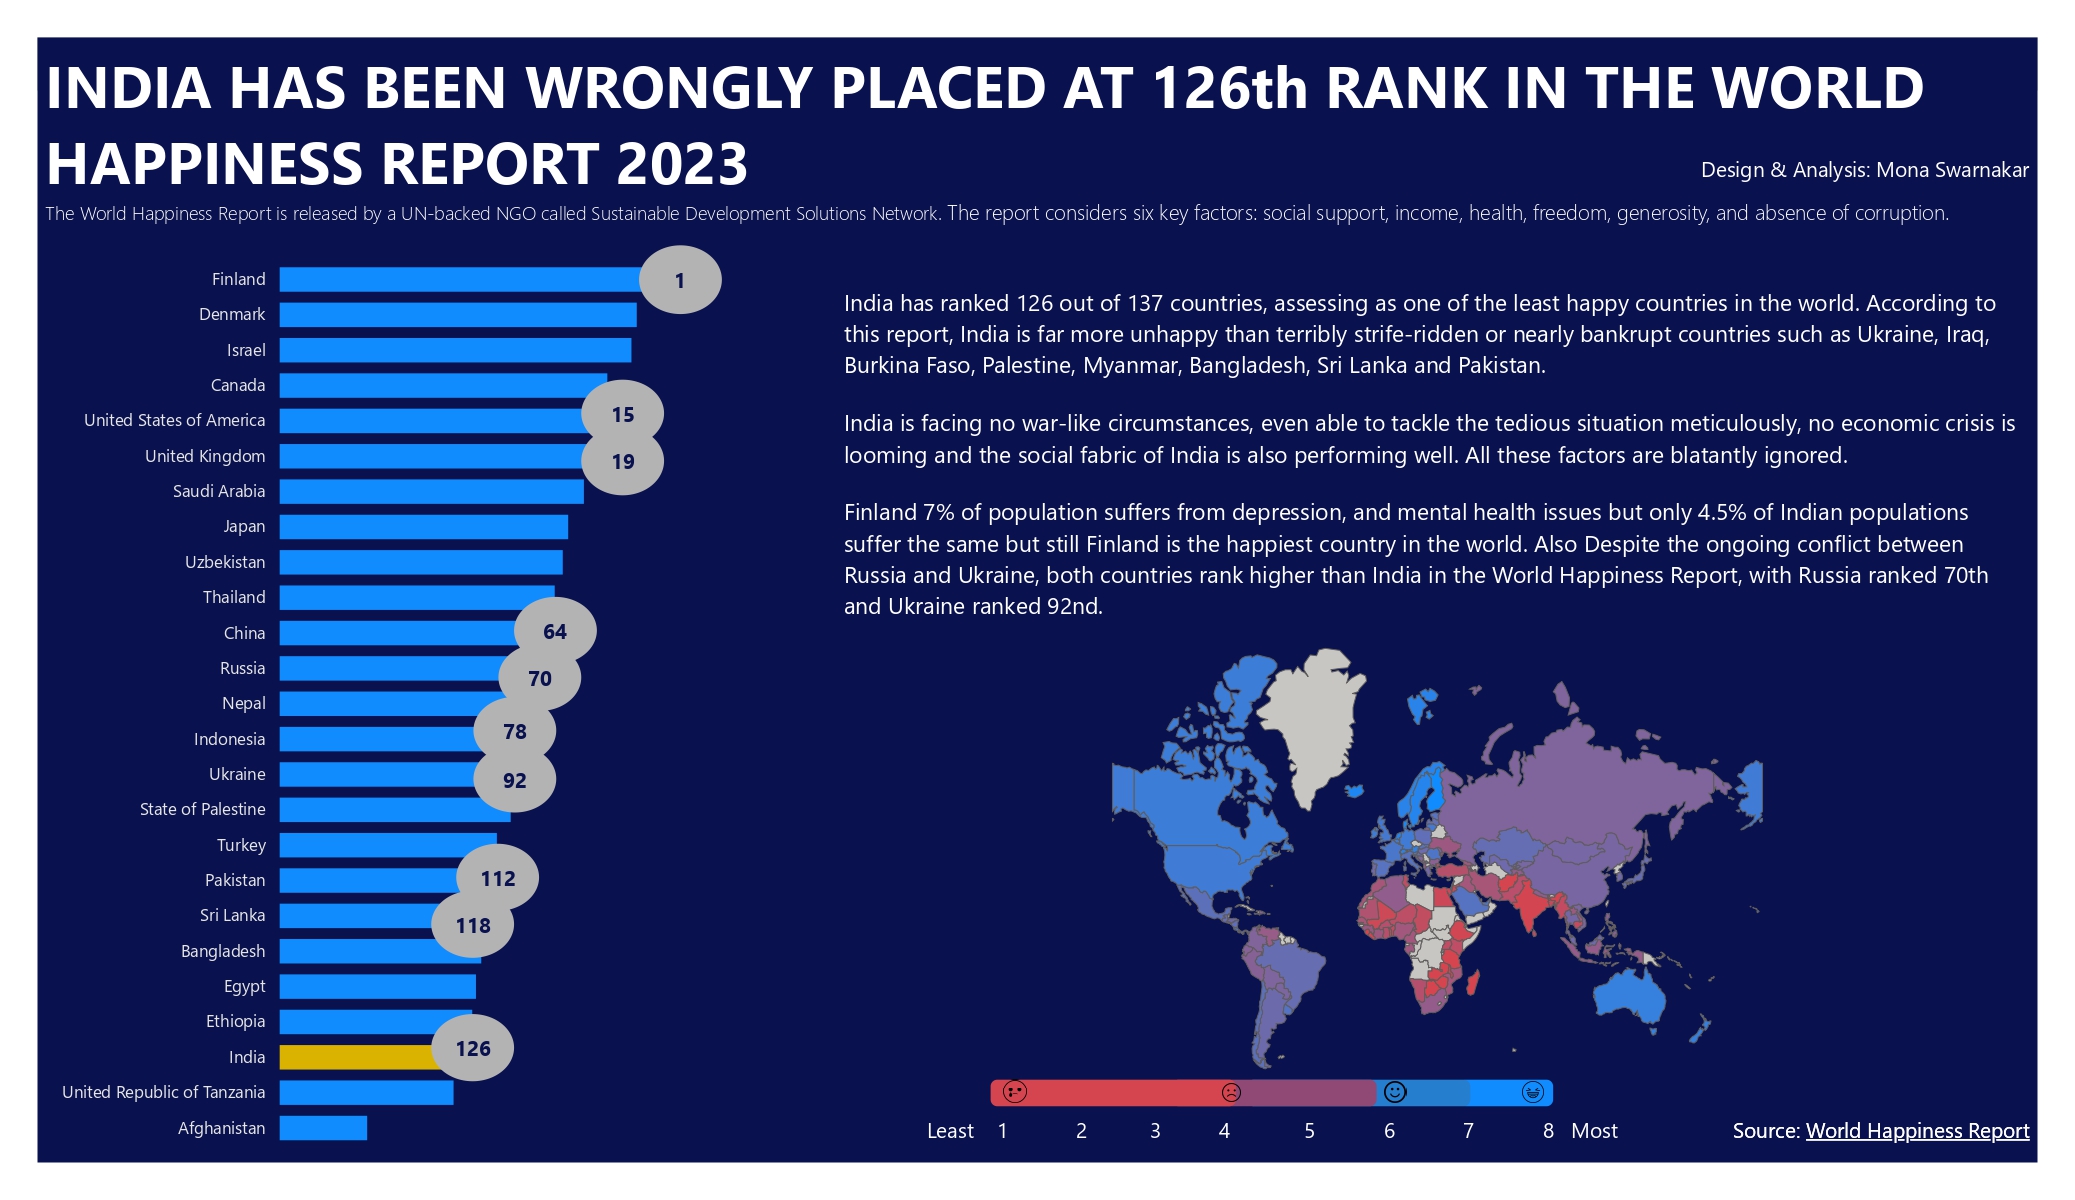
  T h e World Happiness Report is an annual report published by the United Nations Sustainable Development Solutions Network. It ranks countries based on how happy their citizens perceive themselves to be and provides analysis of the factors that contribute to happiness, such as income, social support, and life expectancy. The 2023 World Happiness Report has been released, and it shows that Finland remains the happiest country in the world for the sixth year in a row. Denmark, Iceland, Israel, and the Netherlands are the next happiest countries, with other European countries such as Sweden, Norway, Switzerland, and Luxembourg also making the top 10. Now question raise here that how India’s position in the World Happiness Report has ranked at 136th place, despite having the world’s fastest-growing economy, India’s ranking in the report has consistently been low, leading some to question how it can be ranked lower than countries in turmoil.Despite the ongoing conflict between Russia ...
Provide insights to Telangana Government Tourism Department

Image
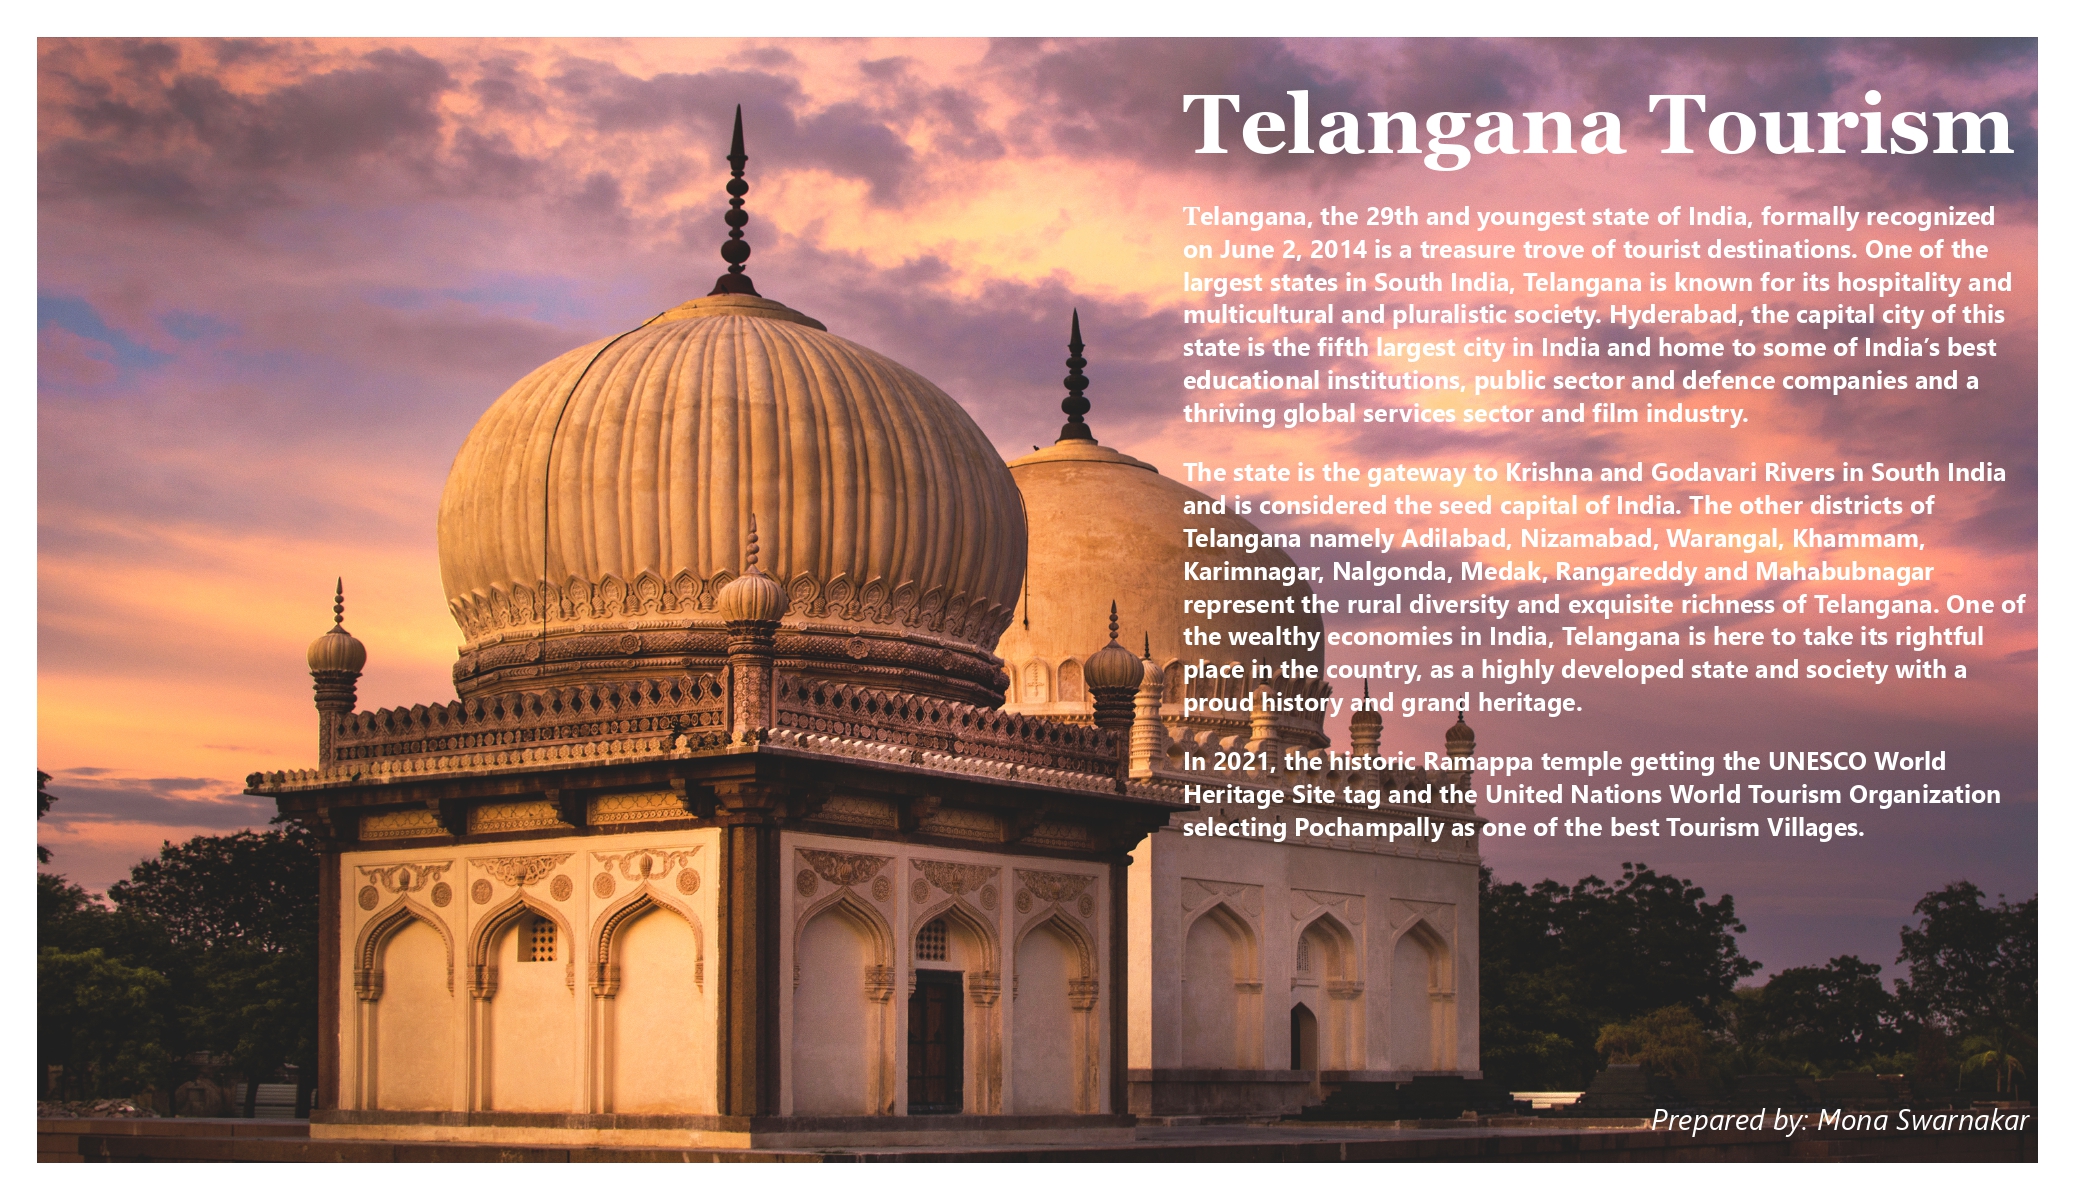
PROBLEM STATEMENT: Telangana is one of the top tourism destination with great places to visit such as forts, temples, rivers, wildlife, etc. The problem here is to identify, how to improve the growth of the tourism sector in Telangana, for both domestic and foreign visitors. TOOLS USED: Only Power BI. FINDINGS I don’t have to introduce about this state – Telangana. We all have read about their culture, historic places, food, streets and everything. However, we are still somewhat lacking in promoting this place and tourists are missing a life time opportunity of visiting this great place. Post the data analysis and research, I found that there are many districts where people are not aware of the cultural and historic places. Also, we need to increase foreign visitors as currently there are only few districts with foreign tourist footprints. As Hyderabad is the capital city of the Telangana, visitors are more there, but we need to focus on all other district as well. SOLUTIONS The Telang...

Mobile Phone Sales Analysis

Image
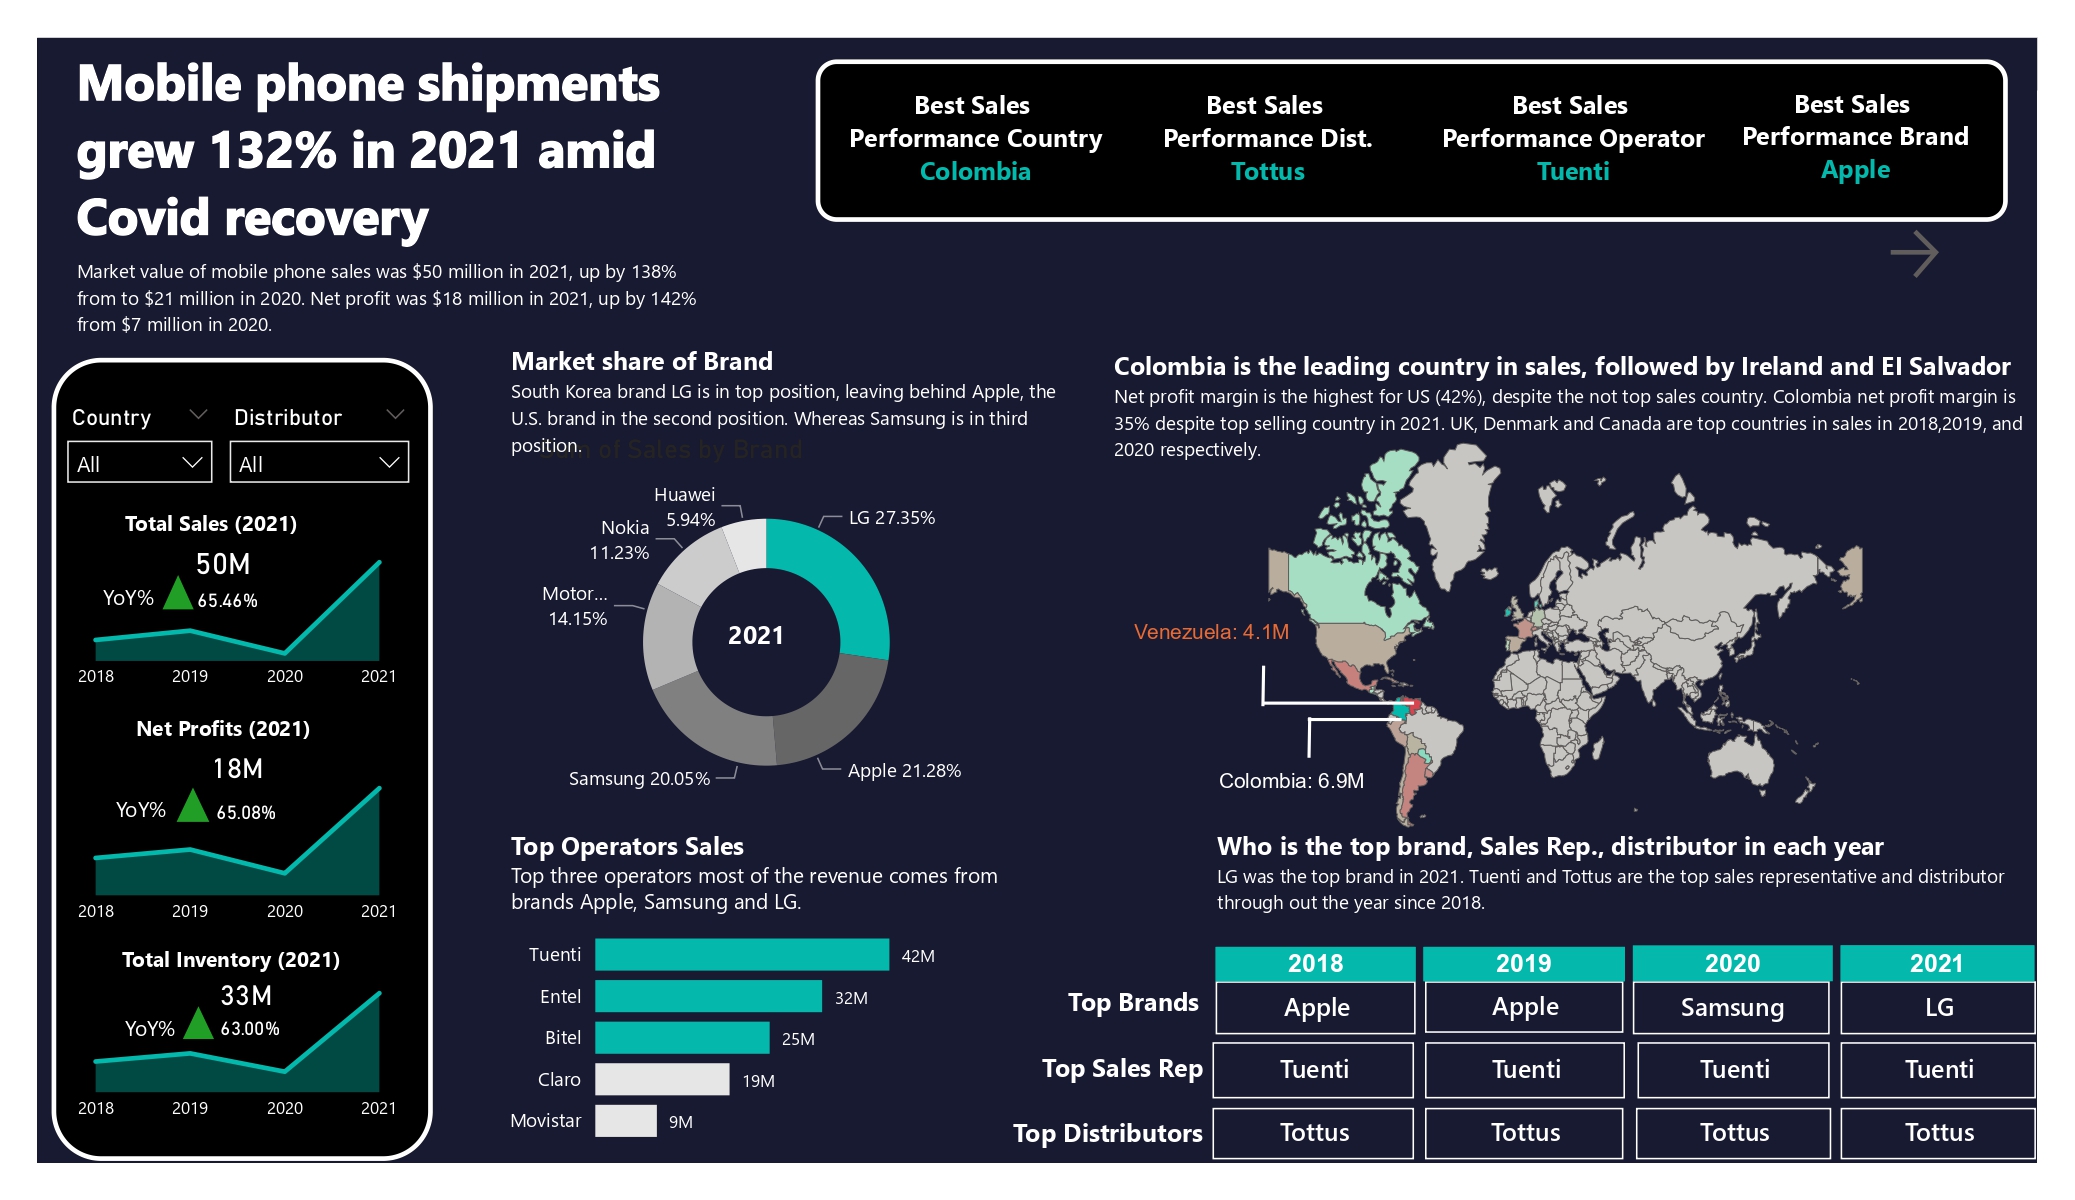
  Project Goal: This role is for a Sales analyst to develop our client's Mobile phone sales analysis report. The client has provided us with relevant mobile phone sales data stored in an Excel file. This is an Exploratory Data Analysis (EDA), so your goal is to explore the business patterns in the data and summarize your discoveries into meaningful sales insights. Project Questions: From 2018-2021, which country and distributor had the best sales performance? What was the seasonal sales trend in each country and distributor? What was the seasonal inventory cost trend in each country and distributor? What was the seasonal net profit trend in each country and distributor? Each year, which brand is the best seller in each country and distributor? Who is each country's most successful sales rep and distributor? Which country had the lowest/highest inventory cost from 2018-2021? Which country had the lowest/highest net profit from 2018-2021? Can we predict the 2023 sales trend based...

HR DATA ANALYSIS

Image
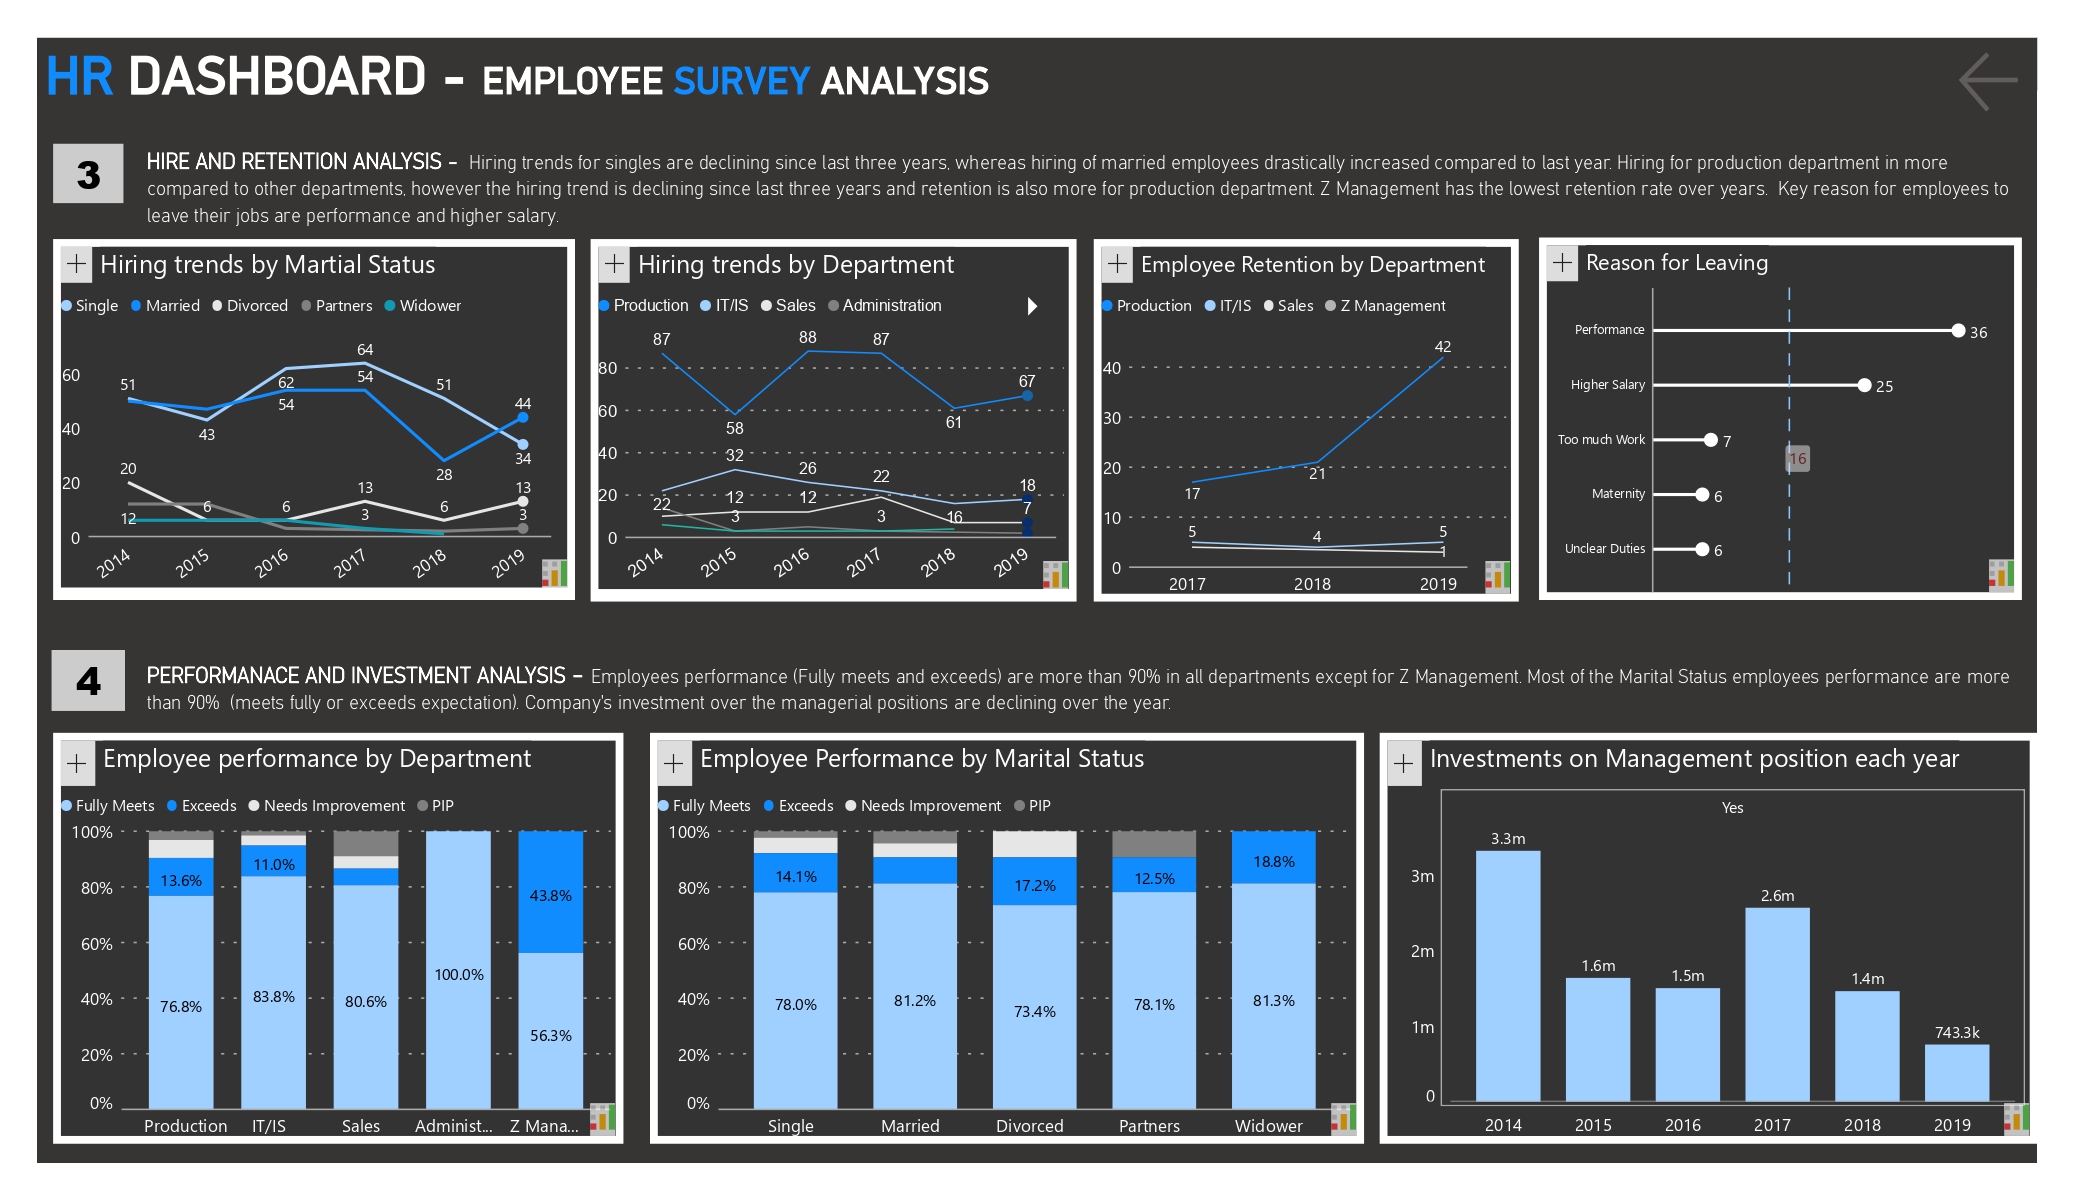
  Project Questions: This role is a HR data analyst to develop a HR Dashboard for your organization. The organization has purchased Inforiver as its primary custom visuals to standardize and simplify the reporting. It is an opportunity for you to show your creativity about our investment. Required to answer a few, not all, the questions below, they are prepared to help you to focus on an aspect of your analysis. Can you find the age segments about the employees? What is the gender ratio each hire year? What is the martial status distributed each hire year? Did number of single new hires increase or decrease historically? What branch had the most/fewest new hires each year? How about the employee retention rate each year? What is the main leave reason? 6. Which department had the most/fewest new hires each year? Which department had the highest/lowest retention rate each year? Which department had the highest/lowest average satisfaction score each year? Can you provide the yearly av...

FIFA World Cup - Who will be winner in 2023?

Image
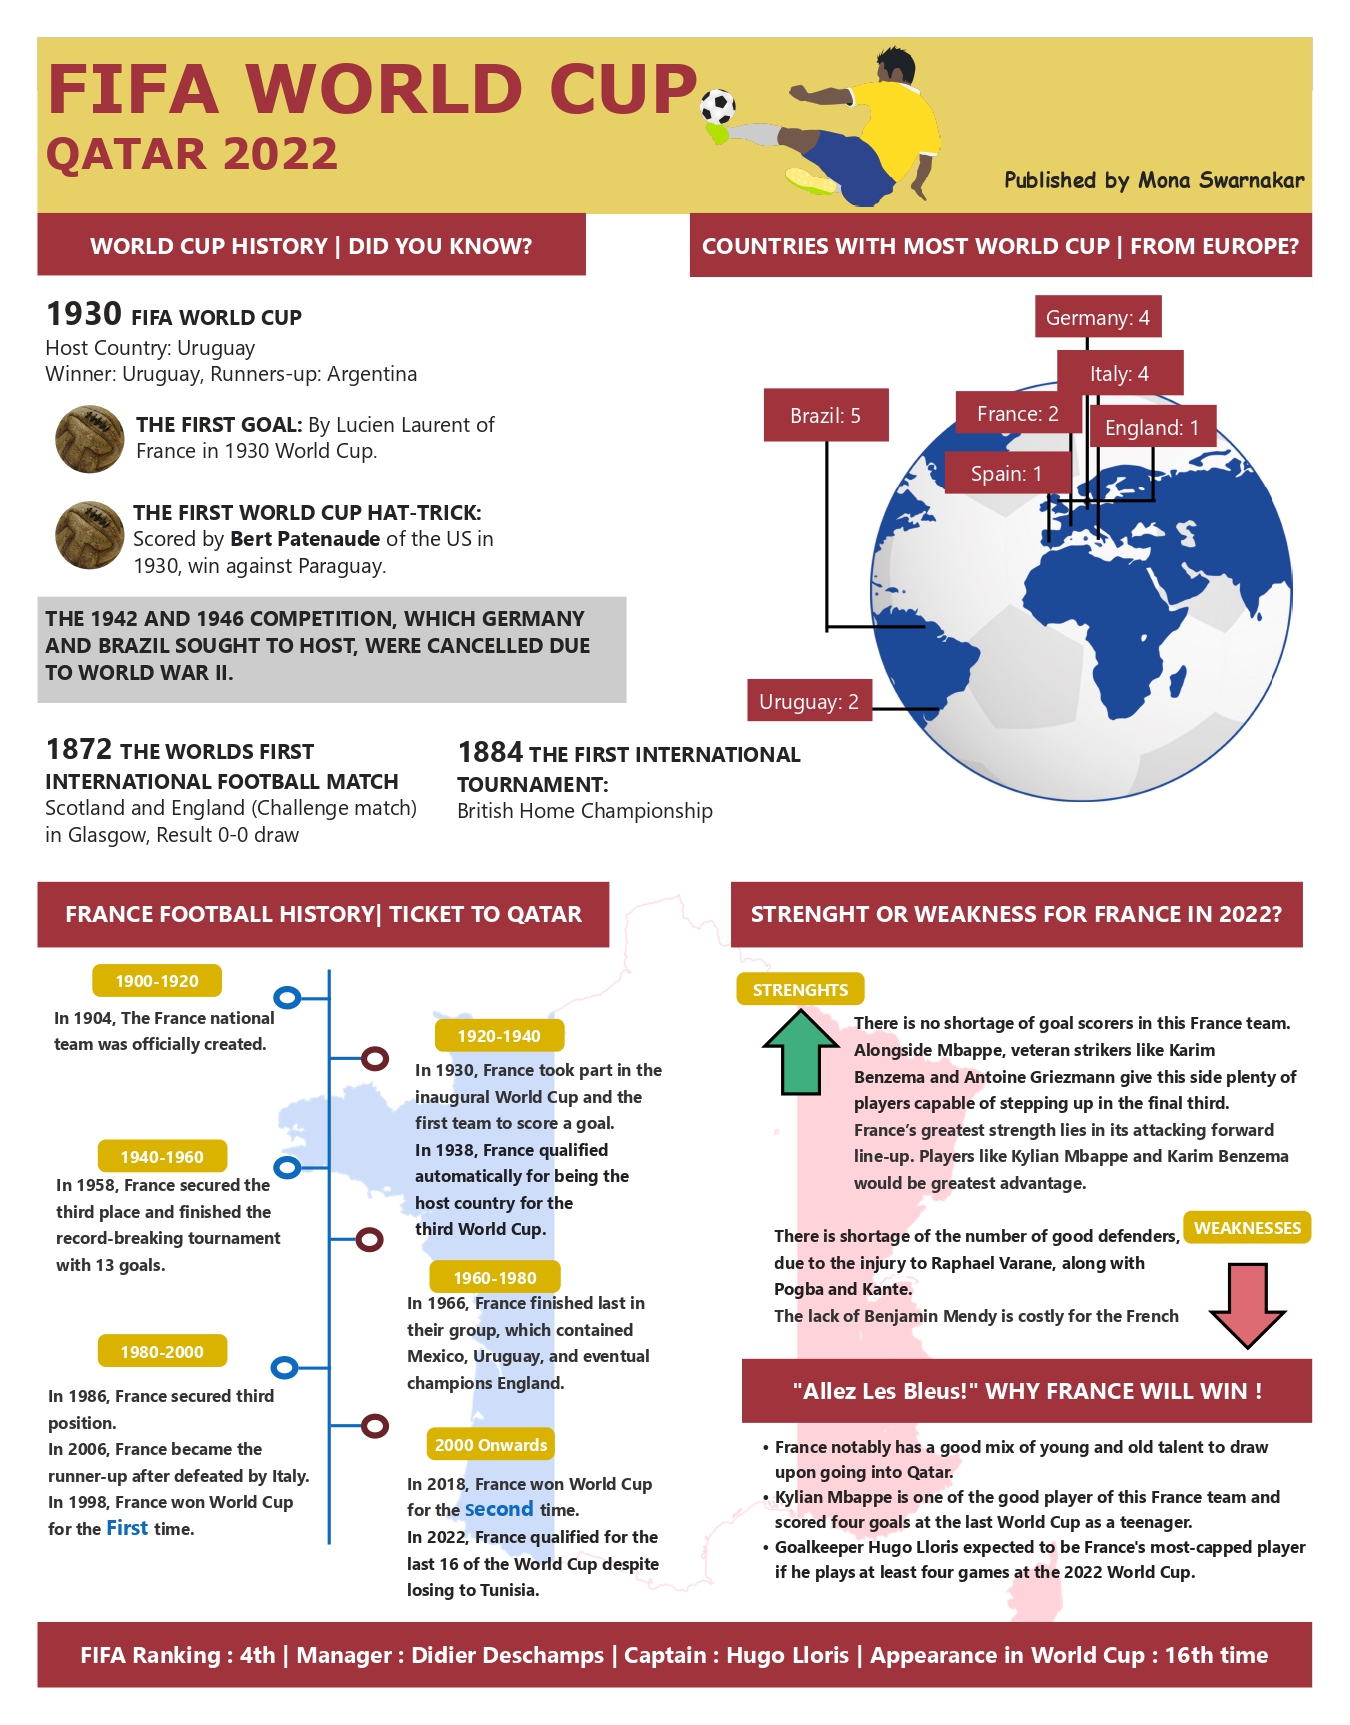
  Historical data leading up to the 2022 FIFA World Cup, including all the matches from the previous world cups, all international matches for the qualified countries, and the groups, squads, and matches for the upcoming tournament. Recommended Analysis How have host countries performed in World Cups over time? Did Qatar follow a similar path? Based on recent form and historical dominance, which countries underperformed in 2022 tournament? Which countries overachieved? How does Argentina's path to glory compare to previous winners? Has your home country participated in a World Cup? How have they fared?

Product Sales Dataset Challenge - DataDNA

Image
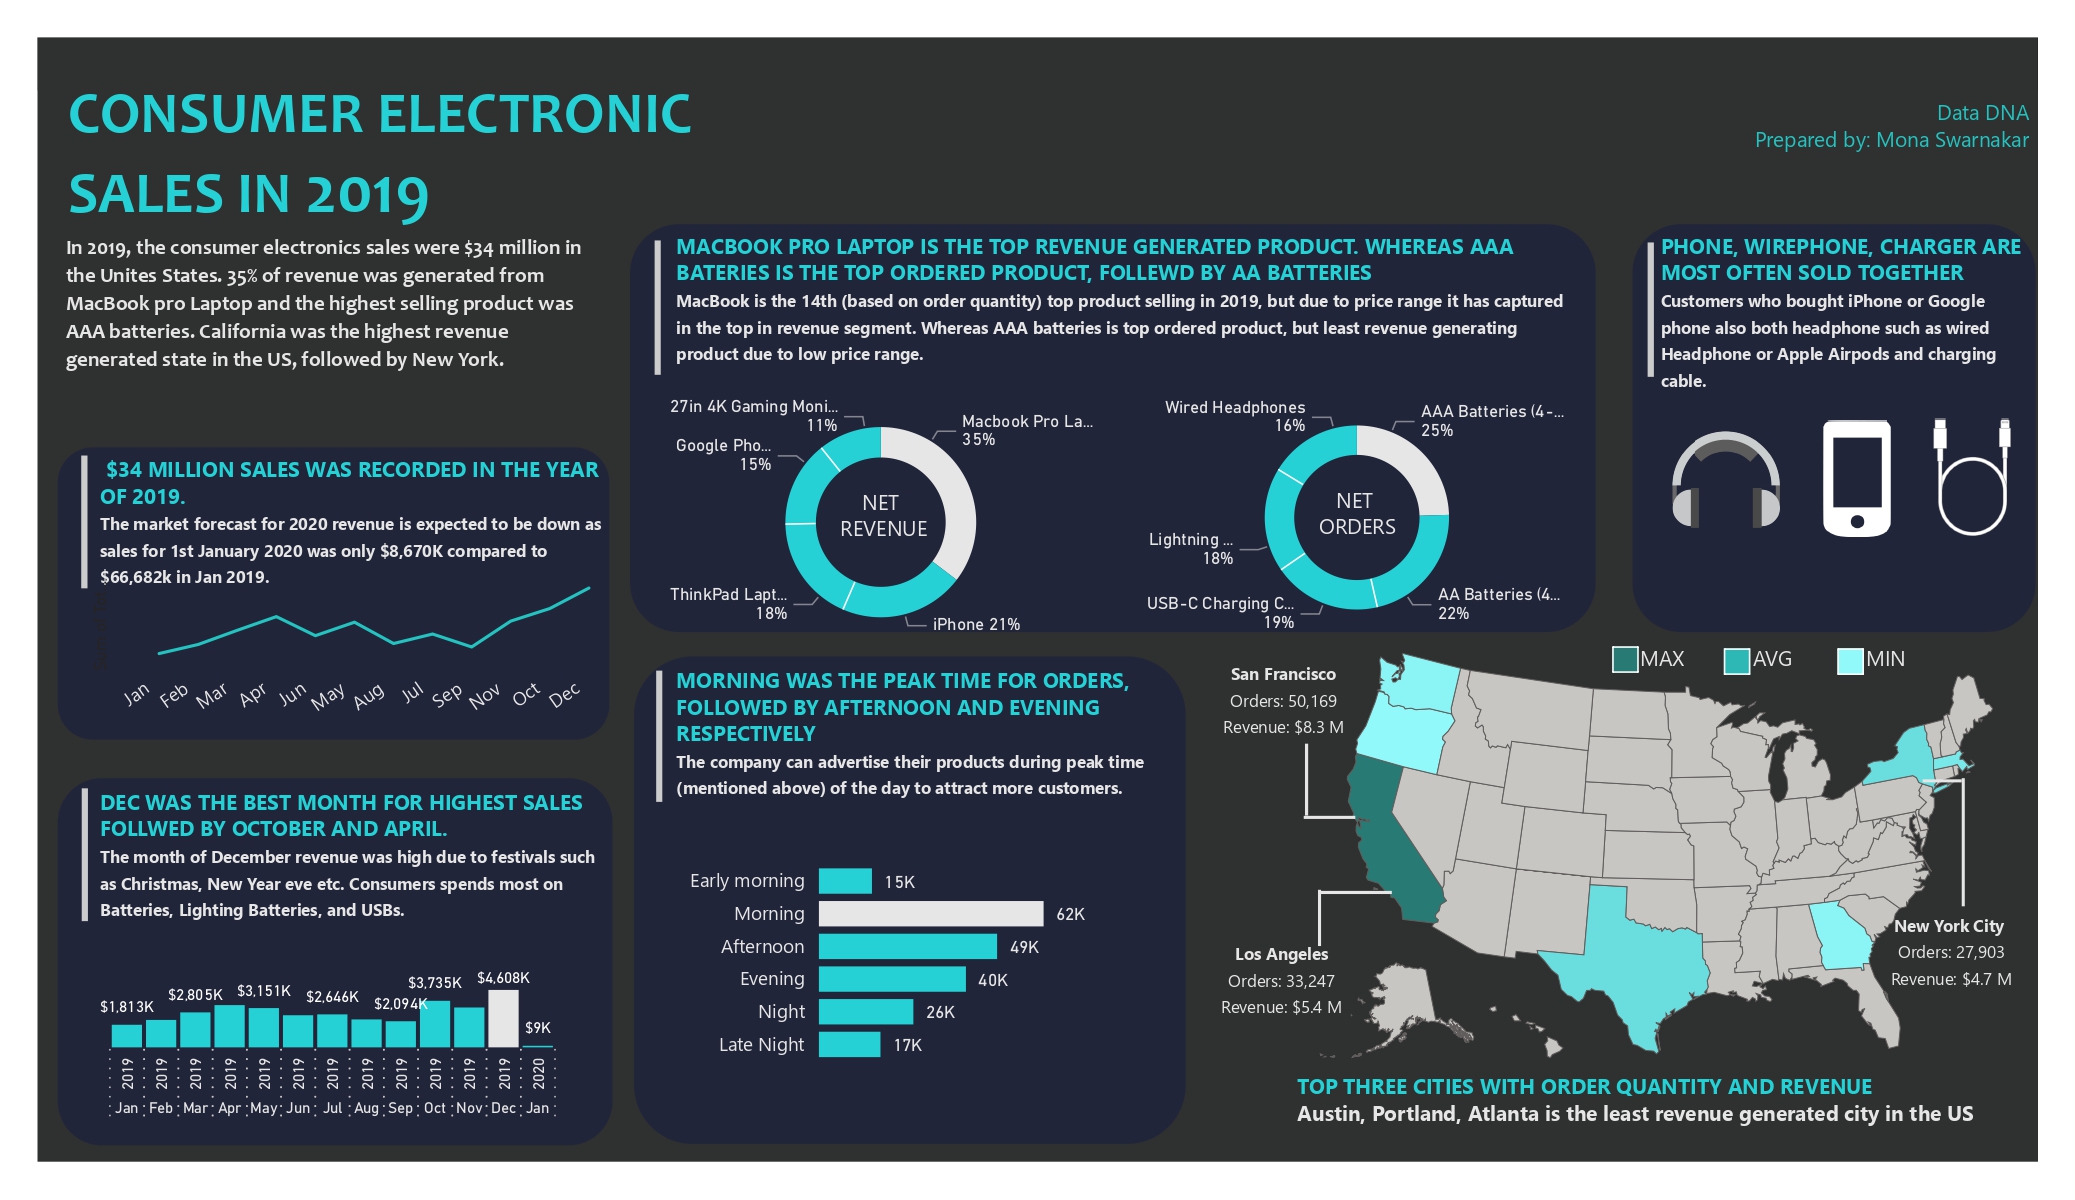
  Recognized as best " Story teller''   for this challenge. Project Challenge Objective Q: What was the best Year for sales? How much was earned that Year? Q: What was the best month for sales? How much was earned that month? Q: What City had the highest number of sales? Q: What time should we display adverstisement to maximize likelihood of customer’s buying product? Q: What products are most often sold together? Q: What product sold the most? Why do you think it sold the most? Tool Used: Power BI

Pizza Place Sales Analysis

Image
  A year's worth of sales from a fictitious pizza place, including the date and time of each order and the pizzas served, with additional details on the type, size, quantity, price, and ingredients. Recommended Analysis How many customers do we have each day? Are there any peak hours? How many pizzas are typically in an order? Do we have any bestsellers? How much money did we make this year? Can we indentify any seasonality in the sales? Are there any pizzas we should take of the menu, or any promotions we could leverage? Tool: Power BI

Forbes World’s Billionaires List 2022 Dataset

Image
  The World's Billionaires  is an annual ranking of people who are considered to have a  net worth  of $1 billion or more, by the American business magazine  Forbes . The list was first published in March 1987. The total net worth of each individual on the list is estimated and is cited in  United States dollars , based on their documented assets and accounting for debt and other factors.  Royalty  and  dictators  whose wealth comes from their positions are excluded from these lists. [3]  This ranking is an index of the wealthiest documented individuals, excluding any ranking of those with wealth that is not able to be completely ascertained.

Parental Leave Policy in the United States

Image
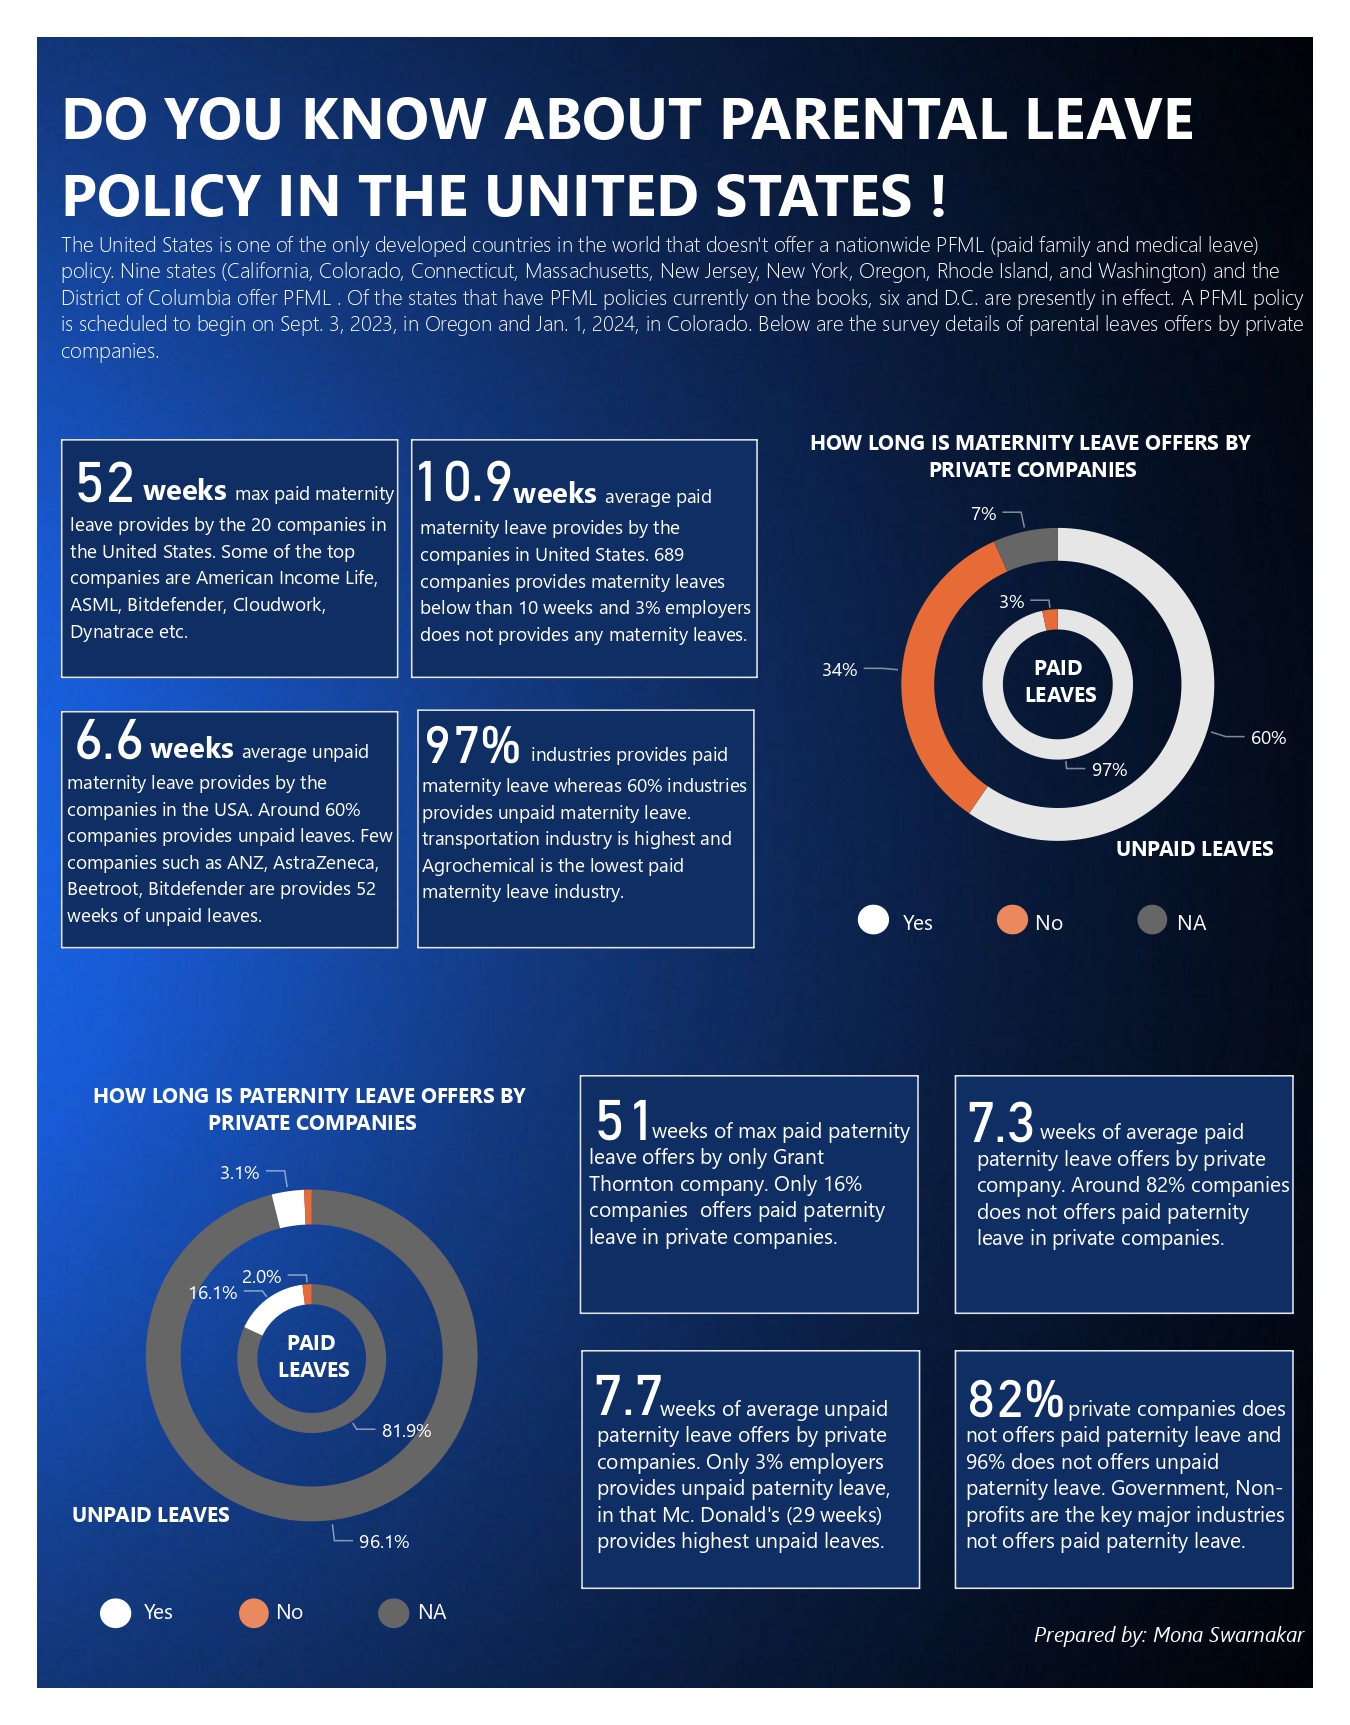
  About the Project Analysis of Parental leaves in the United States. How long the leave provides by private companies and by different industries Is there any difference of Maternity and Paternity leave. About the dataset This dataset contains a  csv table  with 1,601 records, one for each company Each record contains the company's name & industry, as well as crowdsourced information on the paid & unpaid weeks off they offer as part of both their maternity & paternity leave policies (when available) Goal of the project To know about the maximum and average maternity leave by companies To know about the maximum and average paternity leave by companies Provides details and infographic visualization to know about the leaves

United States has more than double unicorns than China

Image
  Data Private companies with a valuation over $1 billion as of March 2022, including each company's current valuation, funding, country of origin, industry, select investors, and the years they were founded and became unicorns. Recommended Analysis Which unicorn companies have had the biggest return on investment? How long does it usually take for a company to become a unicorn? Has it always been this way? Which countries have the most unicorns? Are there any cities that appear to be industry hubs? Which investors have funded the most unicorns? Tool Used: Power BI

Are you looking for top Christmas songs?

Image
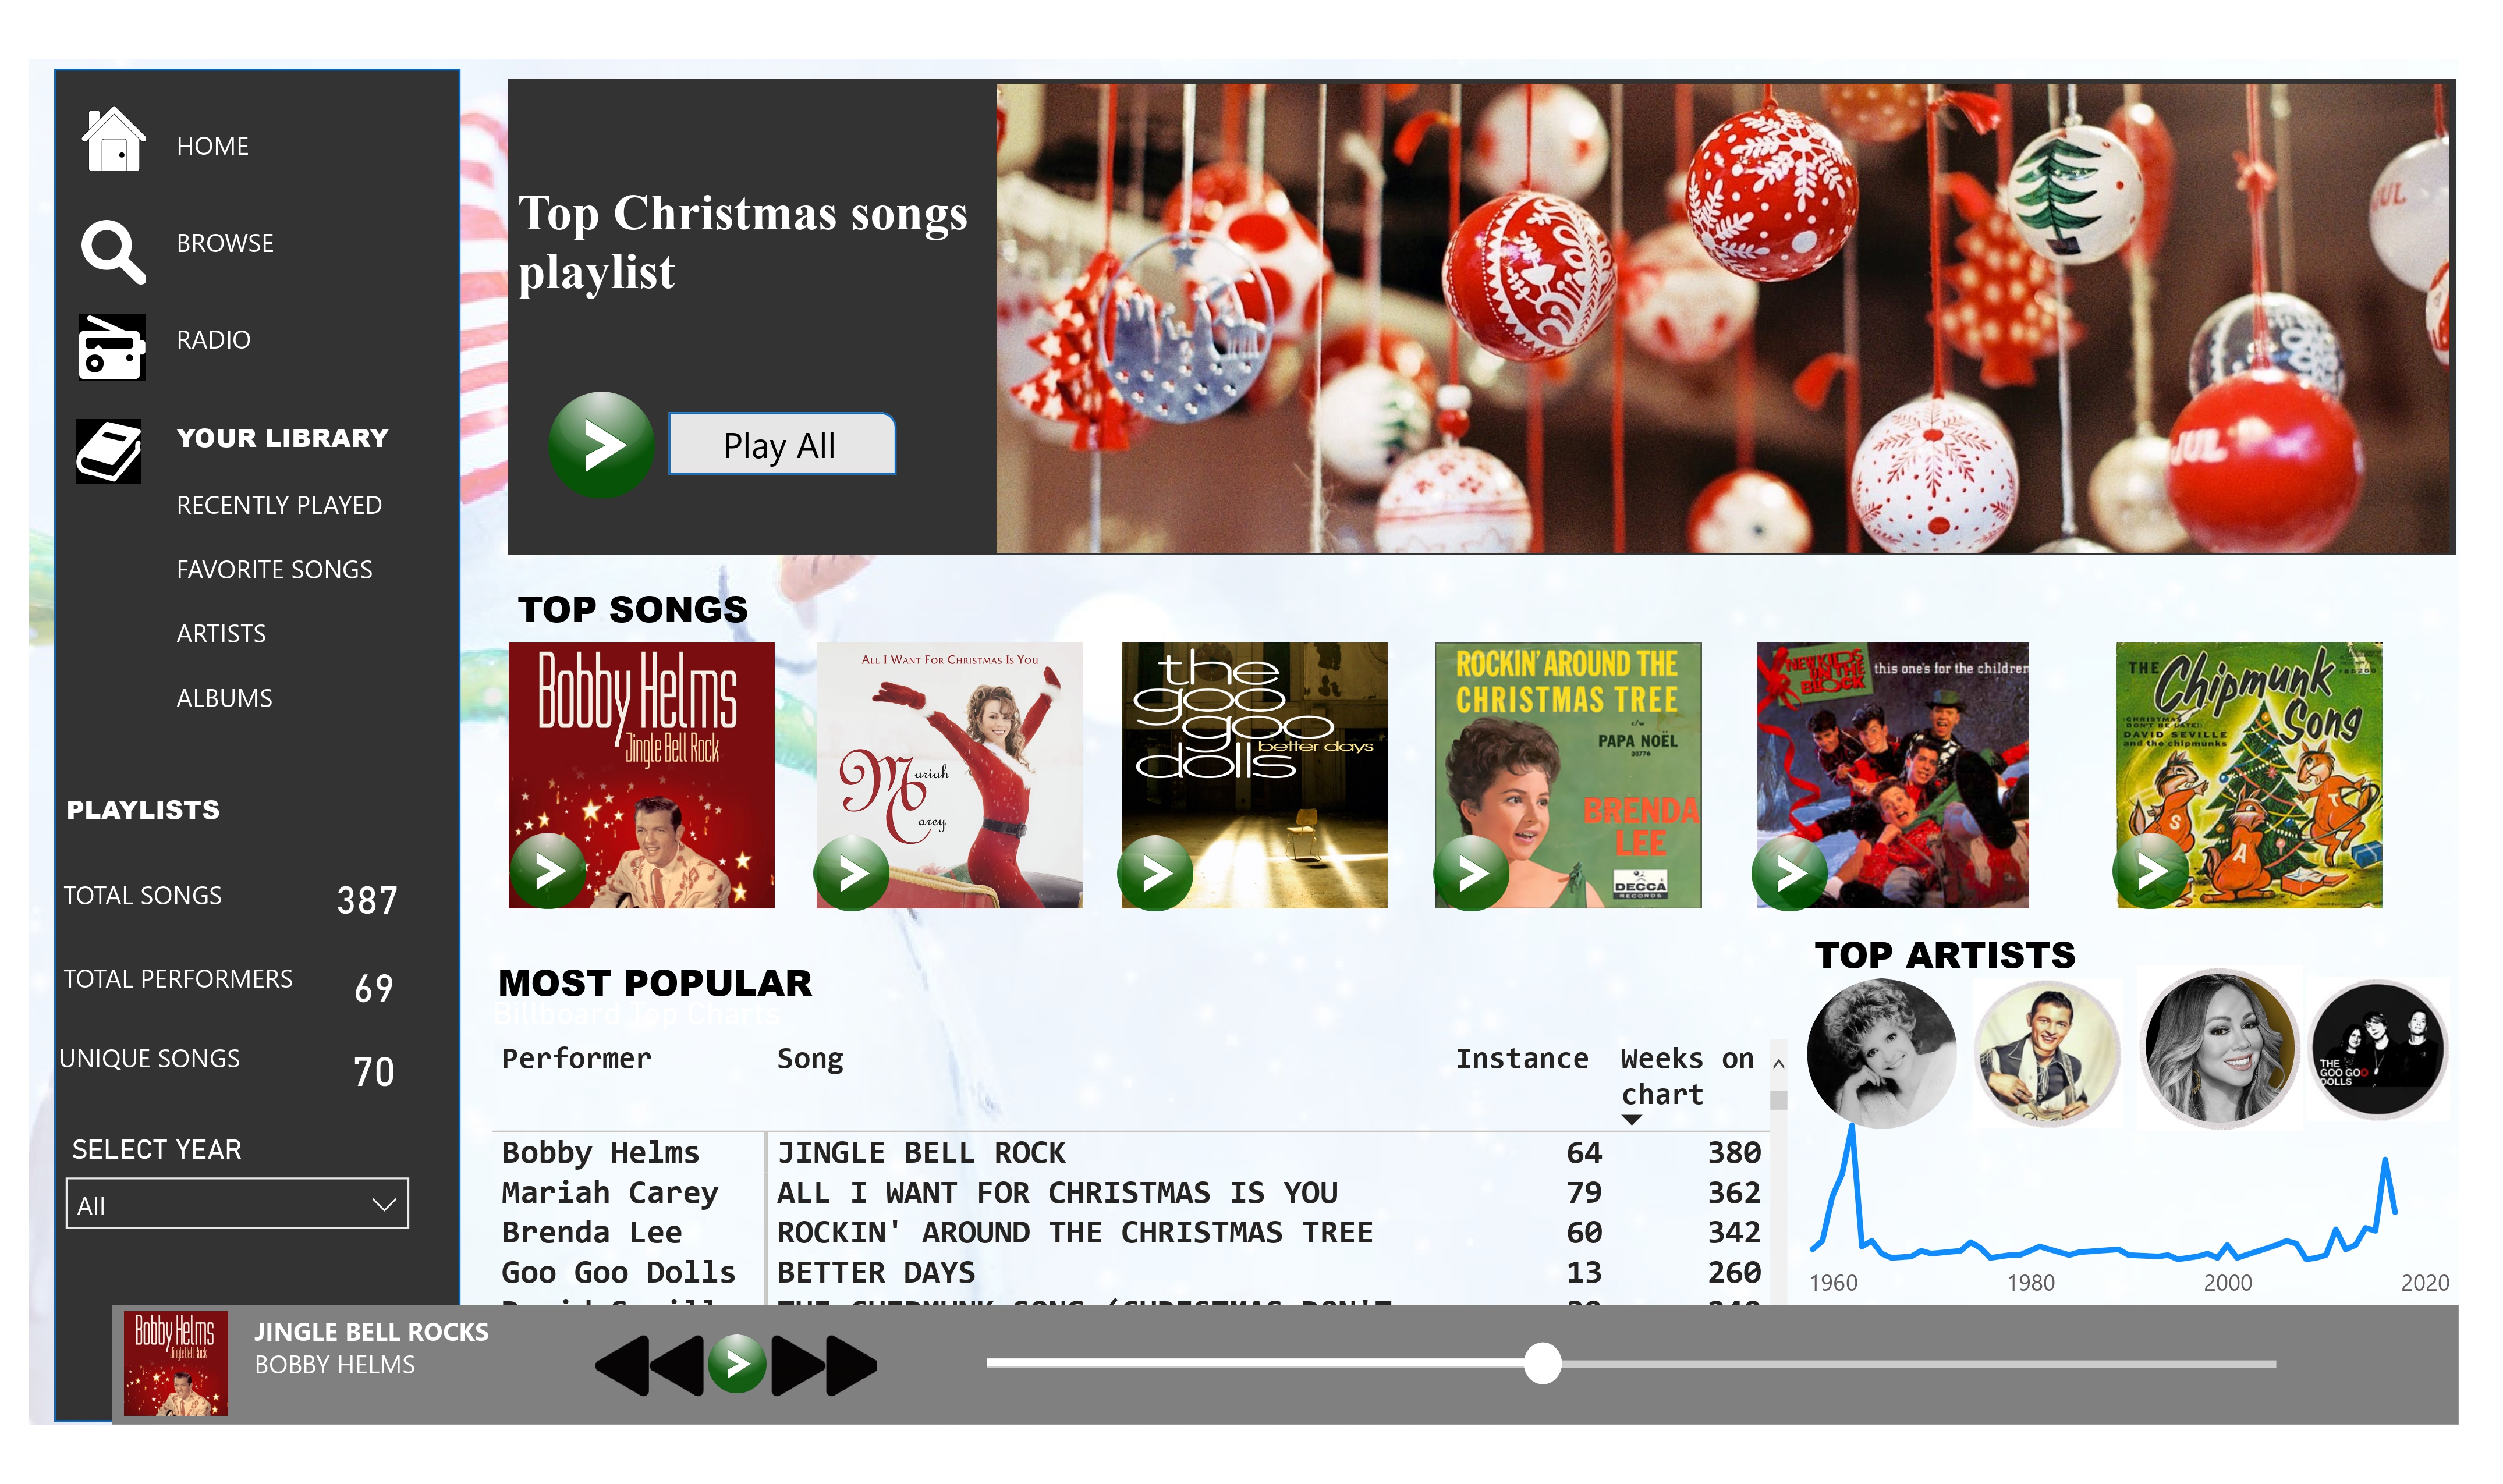
  There are total 387 Christmas songs but Bobby Helms is the top performer of Christmas song since many years. Tool Used : Power BI

The Global Space Exploration Roadmap

Image
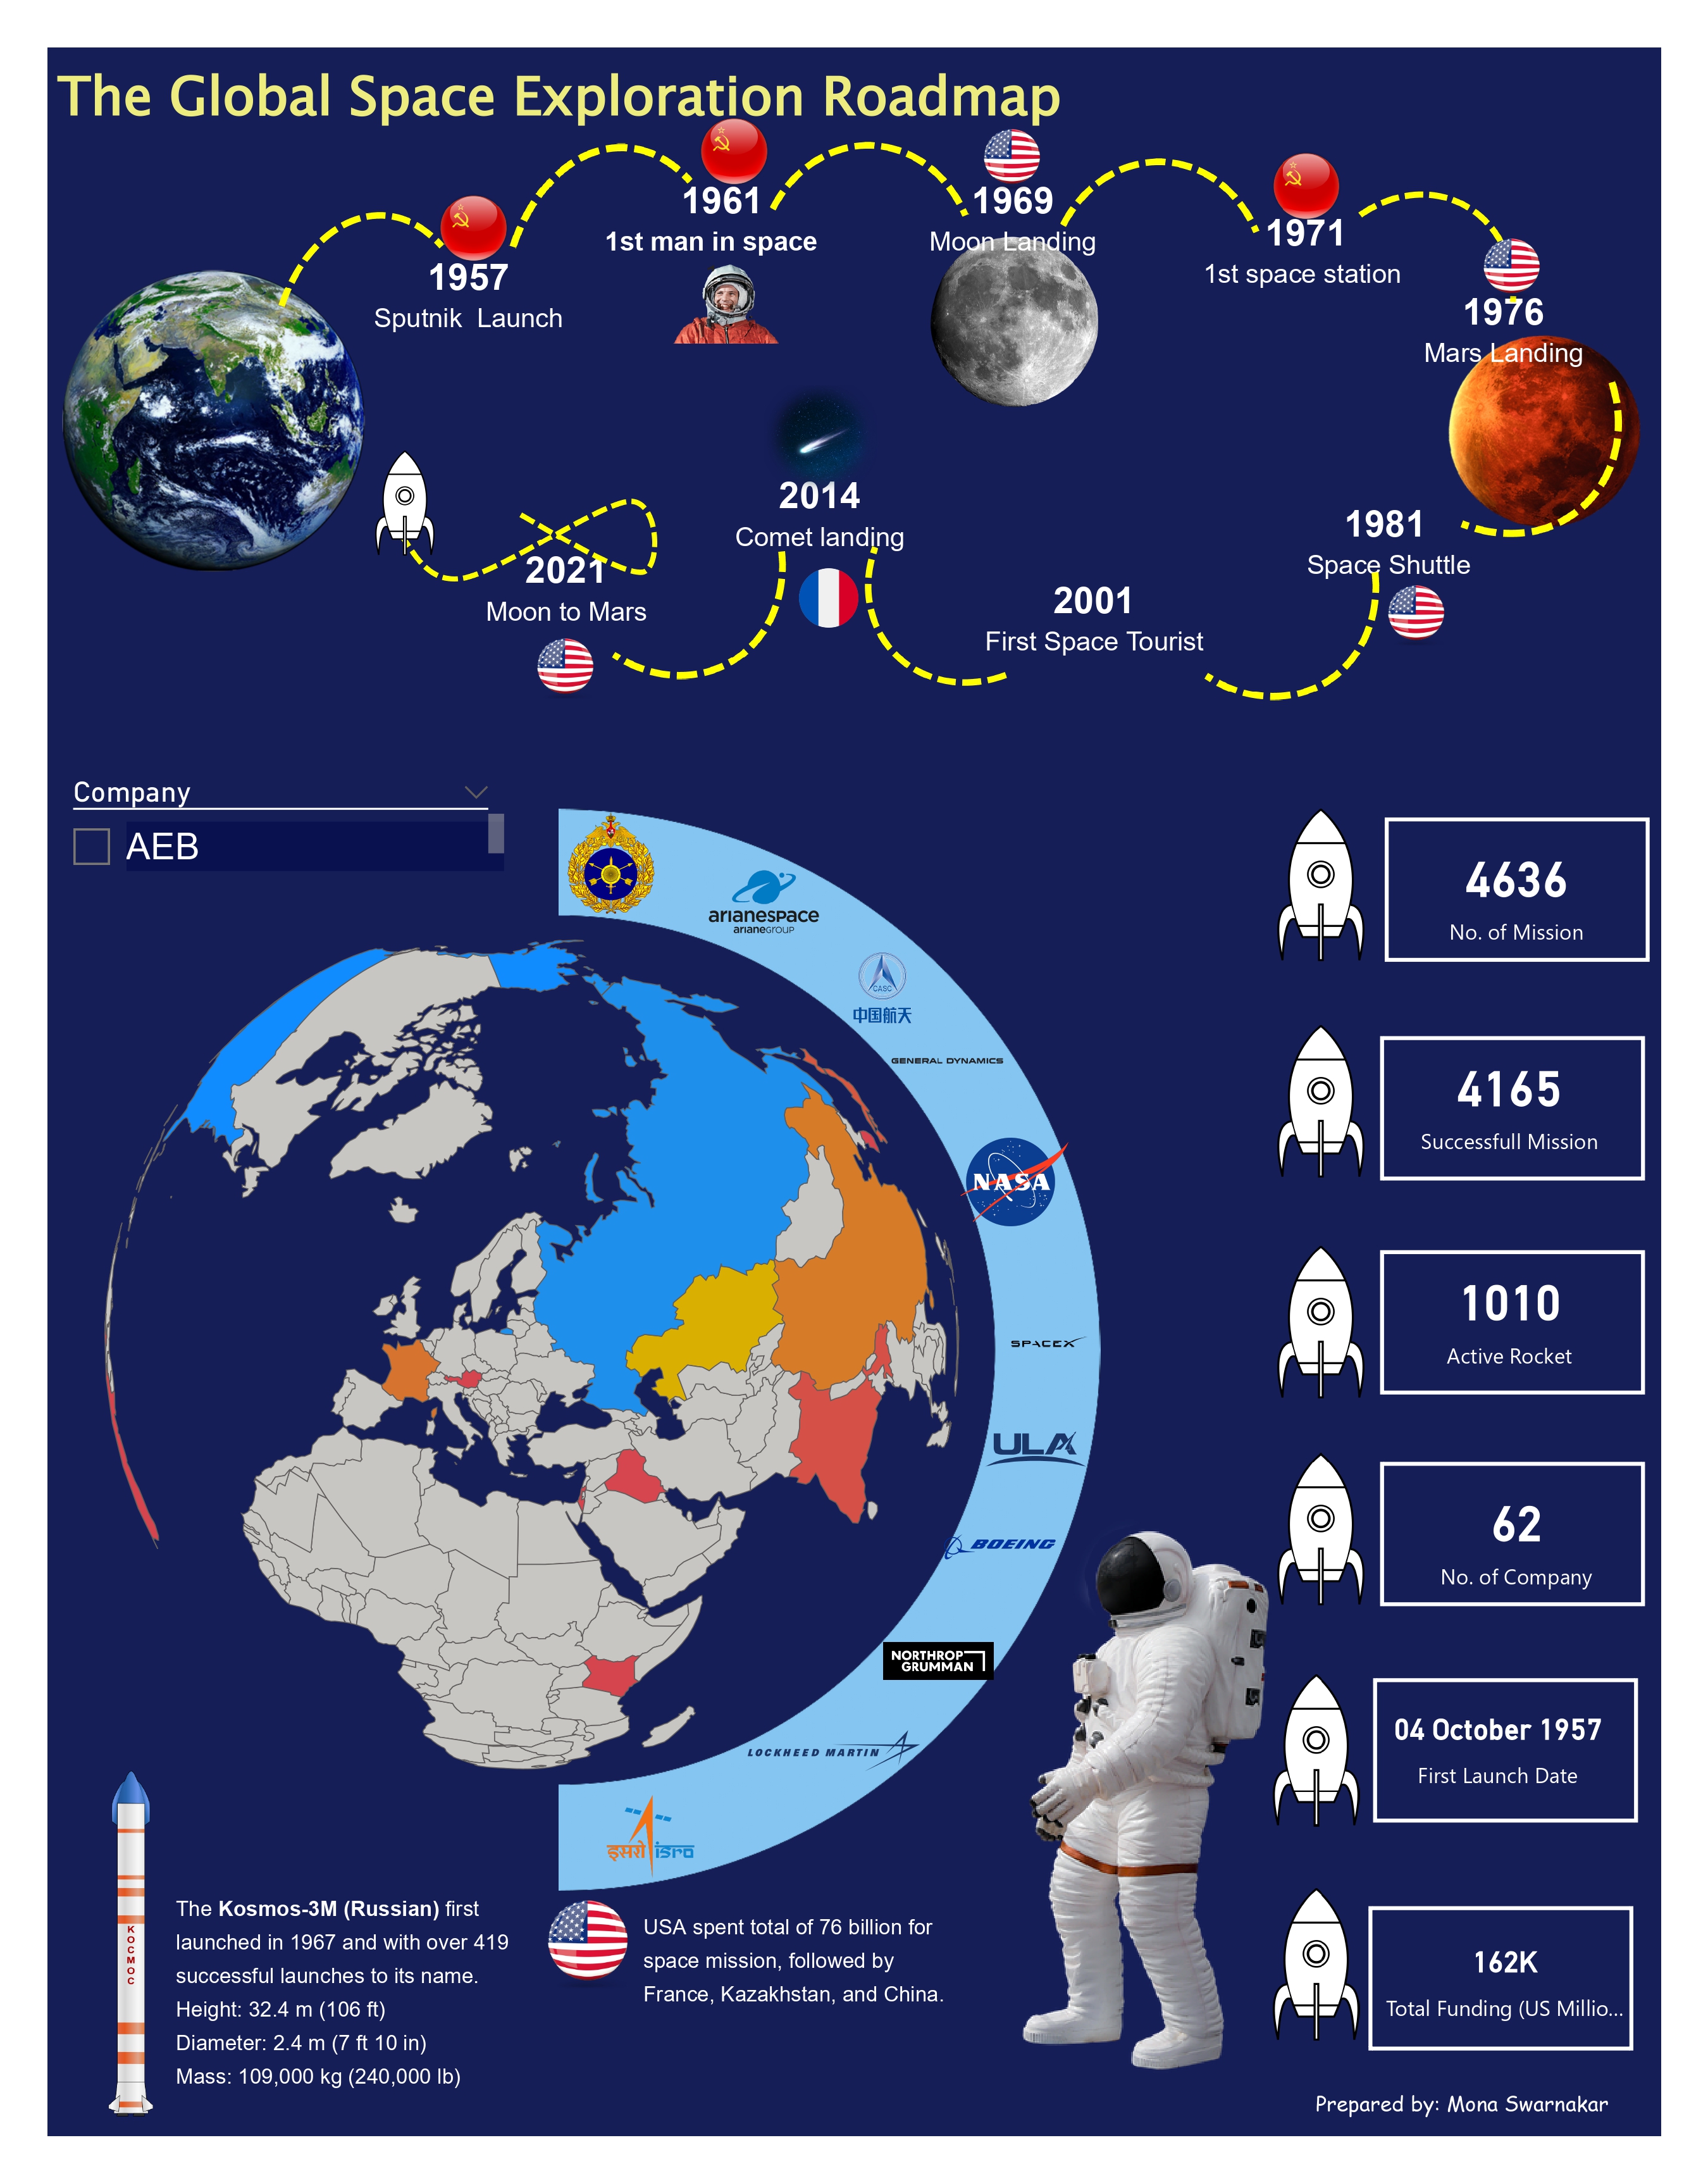
All space missions from 1957 to August 2022, including details on the location, date, and result of the launch, the company responsible, and the name, price, and status of the rocket used for the mission. Recommended Analysis How have rocket launches trended across time? Has mission success rate increased? Which countries have had the most successful space missions? Has it always been that way? Which rocket has been used for the most space missions? Is it still active? Are there any patterns you can notice with the launch locations?  Tool: Power BI

Remote Working Survey - Impact of remote working after COVID-19 pandemic

Image
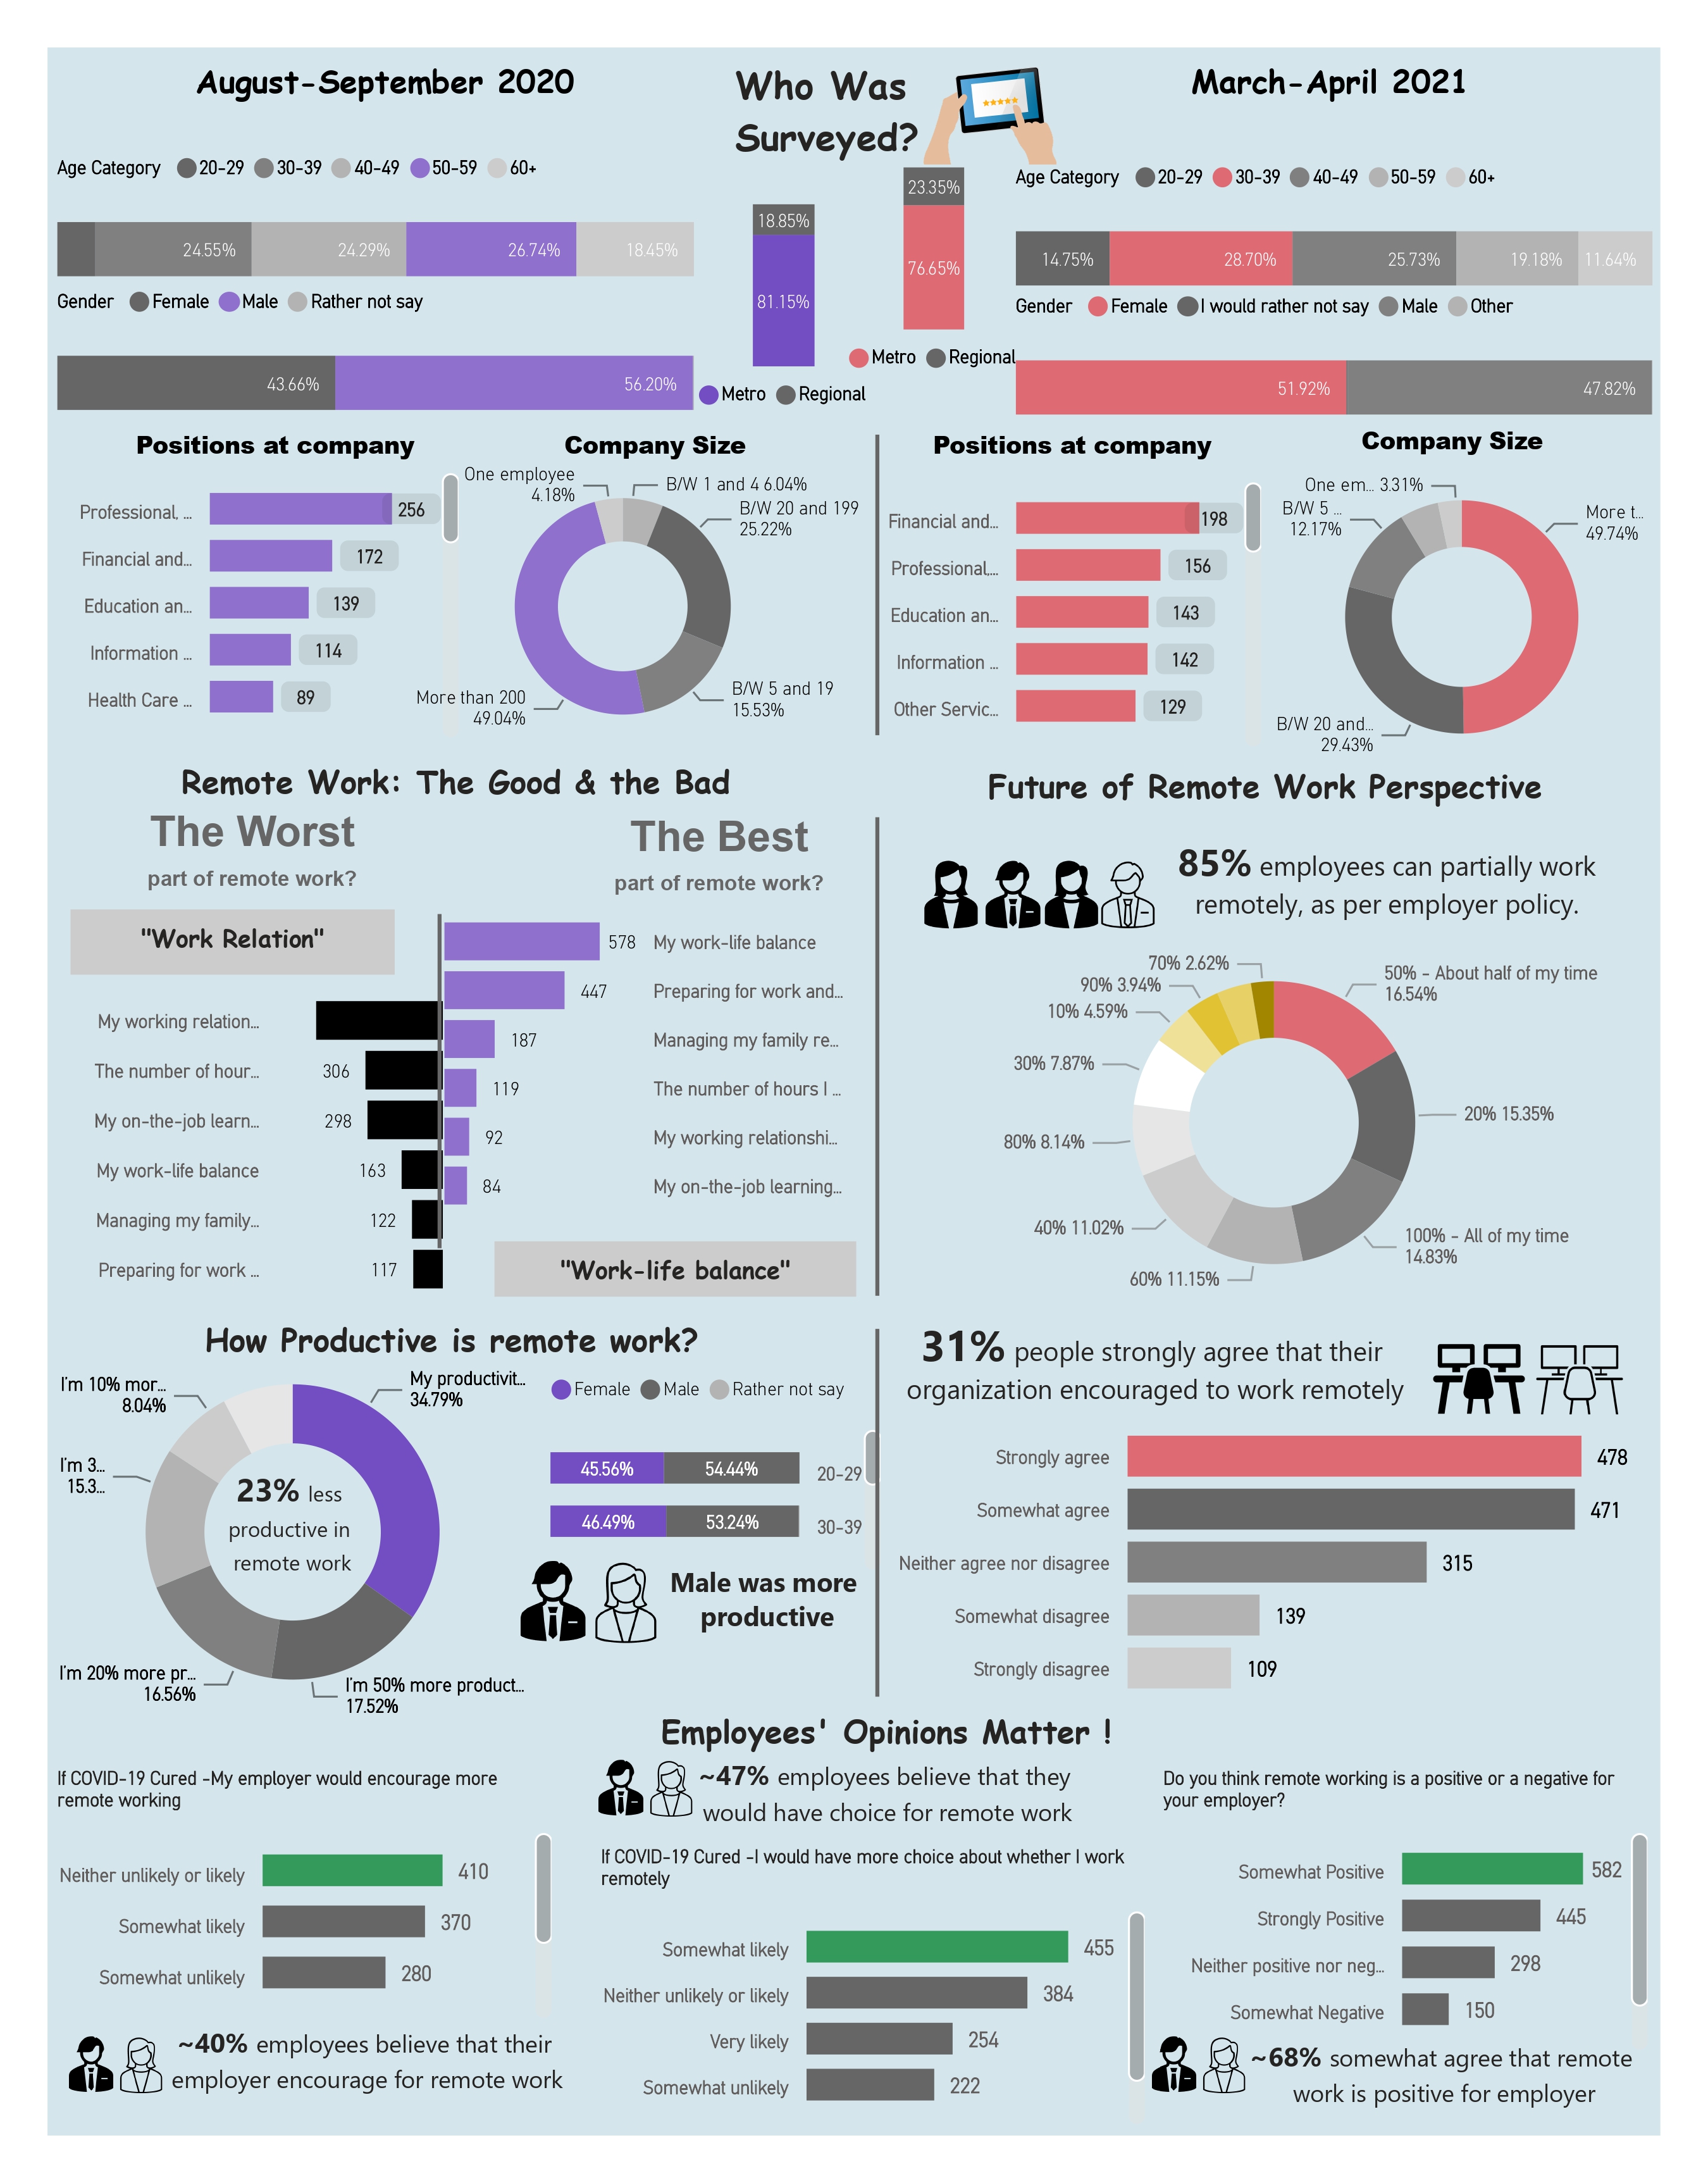
  Recommended Analysis How has the COVID pandemic impacted the amount of work done remotely? What can be expected post-pandemic? Does working remotely positively impact productivity? Are there any other benefits? How does an employees use of time differ when working remotely vs on-site? What are the biggest barriers to overcome if remote work becomes the norm in the future? Tool: Power BI

Fitness Tracker Dataset Challenge

Image
  About the Project: This is a fitness tracker product dataset consisting of different products from various brands with their specifications, ratings and reviews for the Indian market. The data has been collected from e-commerce websites namely Flipkart and Amazon using web scraping technique. This dataset contains 451 samples with 16 attributes. There are some missing values in this dataset. Tool Used: Power BI

Hotel Booking Analysis

Image
Goal of the project: The goal of the projects to analysis the Hotel Bookings of last three years (2015-2017) and provide insights based on the analysis. Data File: Data file consists of one excel folder with 32 columns. Tool Used: Power BI Before starting the Dashboard, I noted down few questions which I need to cover in this dashboard. In this particular challenge, it was not mentioned what is the requirement from this analysis or what questions to be solved as a analyst. The dataset contains 32 columns, which is huge, so though of categorizing my analysis in five different sections: 1. Booking and cancellation 2. Occupancy Rate 3. Customer Demographics 4. Customer Preference 5. Key Insights As the analysis is about the Hotel Industry so, I need to cover the occupancy rate, average ADR, cancellation rate and return rate of customers. i have categorized this key indicators under different sections. In each sections i have mentioned some of the key KPI of Hotel Industry and then i did m...

Top 10 Polluted Countries in the World - 2022

Image
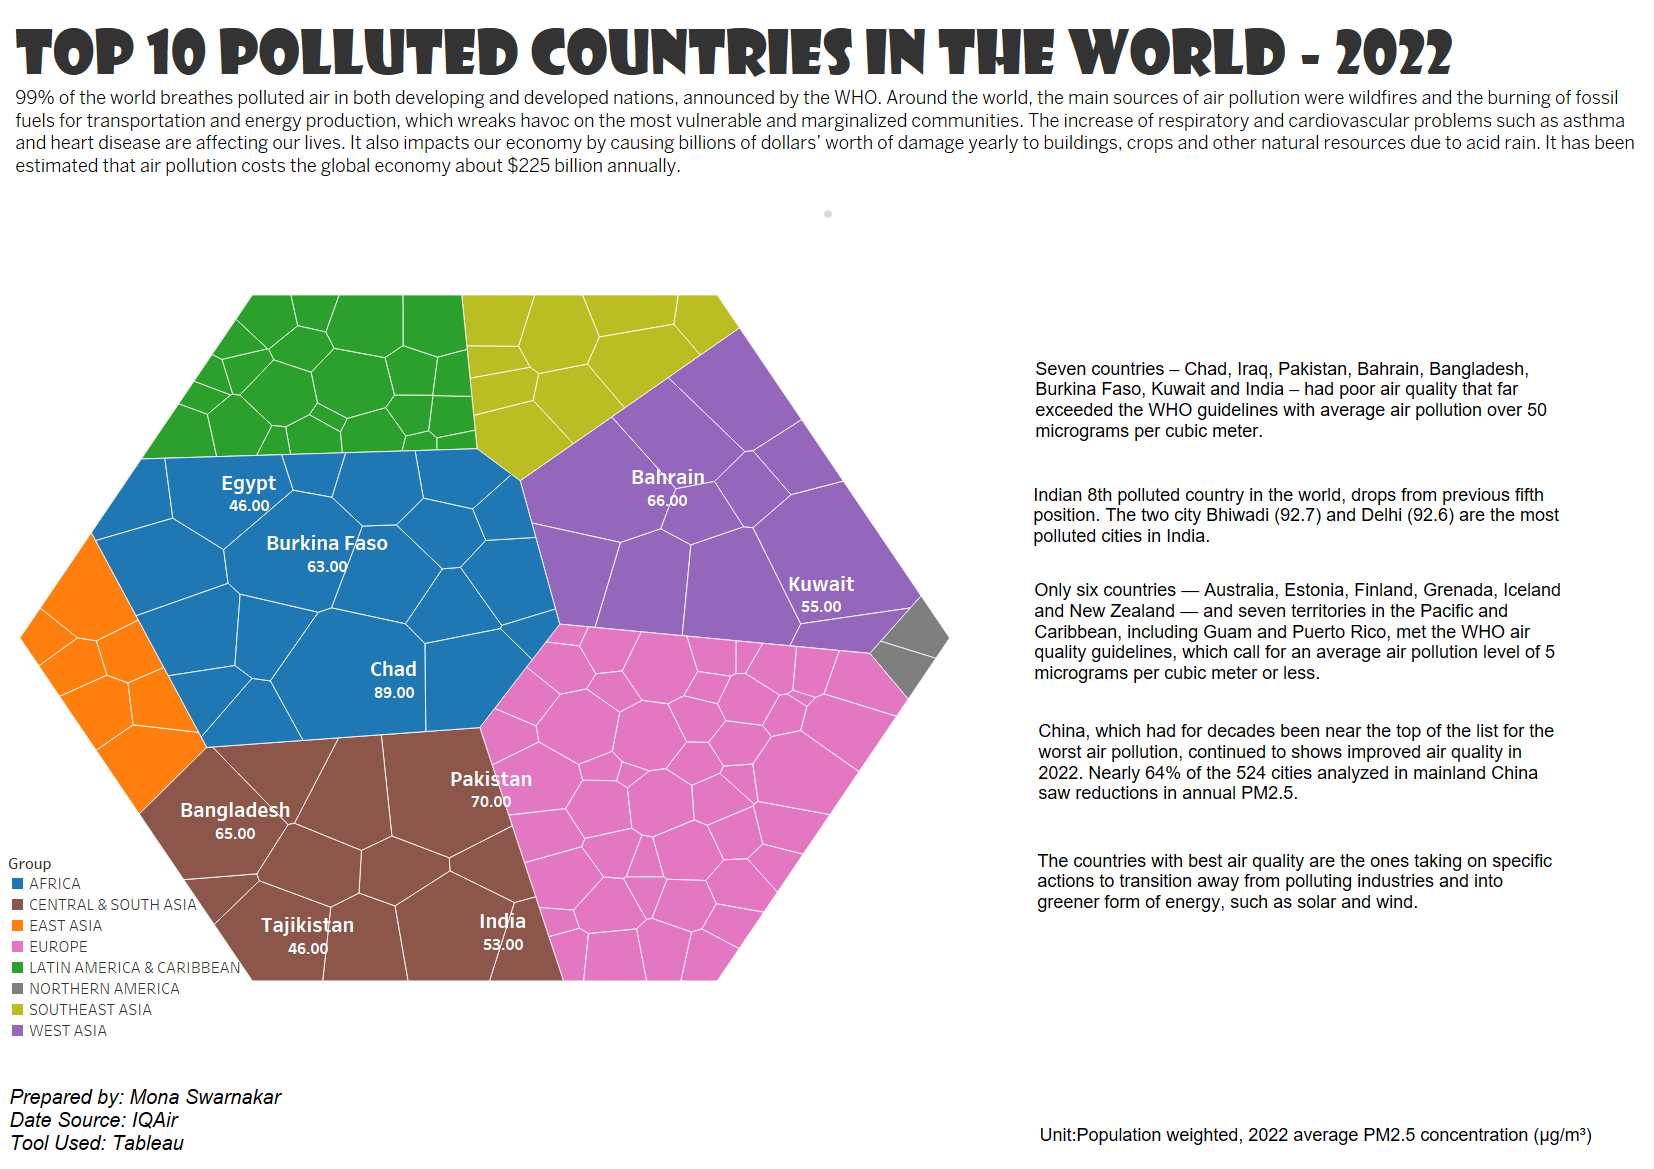
  “Too many people around the world don’t know that they are breathing polluted air,” Aidan Farrow, senior air quality scientist at Greenpeace International, said in a statement. About 90% of the global population in 2022 experienced unhealthy air quality, and only six countries met the World Health Organization’s recommendations of safe air pollutant levels, according to a new report from Swiss air quality technology company IQAir. IQAir measured air quality levels based on the concentration of lung-damaging airborne particles known as PM 2.5. Research shows that exposure to such particulate matter can lead to heart attacks, asthma attacks and premature death. Studies have also linked long-term exposure to PM 2.5 with higher rates of death from Covid-19. The top five most polluted countries in 2022 were Chad, Iraq, Pakistan, Bahrain and Bangladesh. The most polluted cities globally were Lahore, Pakistan; Hotan, China; Bhiwadi, India; Delhi, India; and Pesh...

Romania New Car Registration in 2023

Image
  The Goal of the project: The goal of the project is to provide detailed analysis of new car registration market in Romania. In a single page format, you can the all the necessary details which required to know about the automobile industry. Also need to look how electric segment is doing in the market. What was business needs: The business need of the project to find the growing segment, the top car maker or model their YoY growth, the market share of different car segment etc What are your Insights: My top insights from this project are: 1.The market value is increasing significantly in 2023, which is coming to pre covid level. 2.Gasoline is top segment in car market with more than 65% market share but electric car segment is growing faster than this segment and diesel segment. 3.Dacia is top car maker in Romania and all top five selling cars are from Dacia. Dacia Logan is top selling card model but the top sales growth of the car model is Dacia Jogger. 4.Dacia is the top car se...

Tour de France : History of Largest Sporting Event

Image
  Goal of the Project The goal of the project is to create an infographic-style visual to educate new viewers, highlight the magnitude of the event, and build anticipation for this year's Tour de France. This challenge requirement is different from others as here we are not getting any business insights or solution to do better. Here we have the information and we tried to spread information in easy and simple manner that more viewers can show interest in the coming years. As there are still many people has lack of knowledge about this event and access to watch this event (or lack of resources). What were business need The need is to create an infographic visual to educate new viewers about the world’s largest event Tour de France and 3.5 billion viewers were interested to watch from all around the world. My focus is to attract more viewers and provide base information or history that they don’t know. We are 8 billion population and we have to showcase this largest annual sporting ...